Monitor Web Application Firewall (WAF) logs
editMonitor Web Application Firewall (WAF) logs
editIn this section, you’ll learn how to send AWS WAF events from AWS to your Elastic Stack using Amazon Data Firehose.
You will go through the following steps:
- Select a WAF-compatible resource (for example, a CloudFront distribution)
- Create a delivery stream in Amazon Data Firehose
- Create a web Access Control List (ACL) to generate WAF logs
- Set up logging to forward the logs to the Elastic Stack using a Firehose stream
- Visualize your WAF logs in Kibana
Before you begin
editWe assume that you already have:
- An AWS account with permissions to pull the necessary data from AWS.
- A deployment using our hosted Elasticsearch Service on Elastic Cloud. The deployment includes an Elasticsearch cluster for storing and searching your data, and Kibana for visualizing and managing your data. AWS Data Firehose works with Elastic Stack version 7.17 or greater, running on Elastic Cloud only.
Make sure the deployment is on AWS, because the Amazon Data Firehose delivery stream connects specifically to an endpoint that needs to be on AWS.
Step 1: Install the AWS integration in Kibana
edit- Find Integrations in the main menu or use the global search field.
- Browse the catalog to find the AWS integration.
- Navigate to the Settings tab and click Install AWS assets.
Step 2: Create a delivery stream in Amazon Data Firehose
edit- Go to the AWS console and navigate to Amazon Data Firehose.
-
Click Create Firehose stream and choose the source and destination of your Firehose stream. Unless you are streaming data from Kinesis Data Streams, set source to
Direct PUTand destination toElastic. -
Provide a meaningful Firehose stream name that will allow you to identify this delivery stream later. Your Firehose name must start with the prefix
aws-waf-logs-or it will not show up later.
For advanced use cases, source records can be transformed by invoking a custom Lambda function. When using Elastic integrations, this should not be required.
Step 3: Specify the destination settings for your Firehose stream
edit-
From the Destination settings panel, specify the following settings:
-
To find the Elasticsearch endpoint URL:
- Go to the Elastic Cloud console
- Find your deployment in the Hosted deployments card and select Manage.
- Under Applications click Copy endpoint next to Elasticsearch.
-
Make sure that your Elasticsearch endpoint URL includes
.es.between the deployment name and region. Example:https://<deployment_name>.es.<region>.<csp>.elastic-cloud.com
-
To create the API key:
- Go to the Elastic Cloud console
- Select Open Kibana.
-
Expand the left-hand menu, under Management select Stack management > API Keys and click Create API key. If you are using an API key with Restrict privileges, make sure to review the Indices privileges to provide at least
auto_configureandwritepermissions for the indices you will be using with this delivery stream.
- Content encoding: To reduce the data transfer costs, use GZIP encoding.
- Retry duration: Determines how long Firehose continues retrying the request in the event of an error. A duration between 60 and 300 seconds should be suitable for most use cases.
-
- It is recommended to configure S3 backup for failed records from the Backup settings panel. These backups can be used to restore data losses caused by unforeseen service outages.
Step 4: Create a web access control list
editTo create a new web access control list (ACL), follow these steps:
- Go to the AWS console and navigate to the WAF & Shield page.
- Describe web ACL by entering the resource type, region, and name.
-
Associate it to an AWS resource. If you don’t have an existing resource, you can create and attach a web ACL to several AWS resources:
- CloudFront distribution
- Application Load Balancers
- Amazon API Gateway REST APIs
- Amazon App Runner services
- AWS AppSync GraphQL APIs
- Amazon Cognito user pools
- AWS Verified Access Instances
- Add a 1 or 2 rules to the Free rule groups list from the AWS managed rule groups. Keep all other settings to their default values.
- Set the rule priority by keeping default values.
- Configure metrics by keeping default values.
- Review and create the web ACL.
Step 5: Set up logging
edit- Go to the web ACL you created in the previous step.
-
Open the Logging and metrics section and edit the following settings:
- Logging destination: select "Amazon Data Firehose stream"
- Amazon Data Firehose stream: select the Firehose stream you created in step 2.
WAF creates the required Identity and Access Management (IAM) role.
If your Firehose stream name doesn’t appear in the list, make sure the name you chose for the stream starts with aws-waf-logs-, as prescribed by AWS naming conventions.
Step 6: Visualize your WAF logs in Kibana
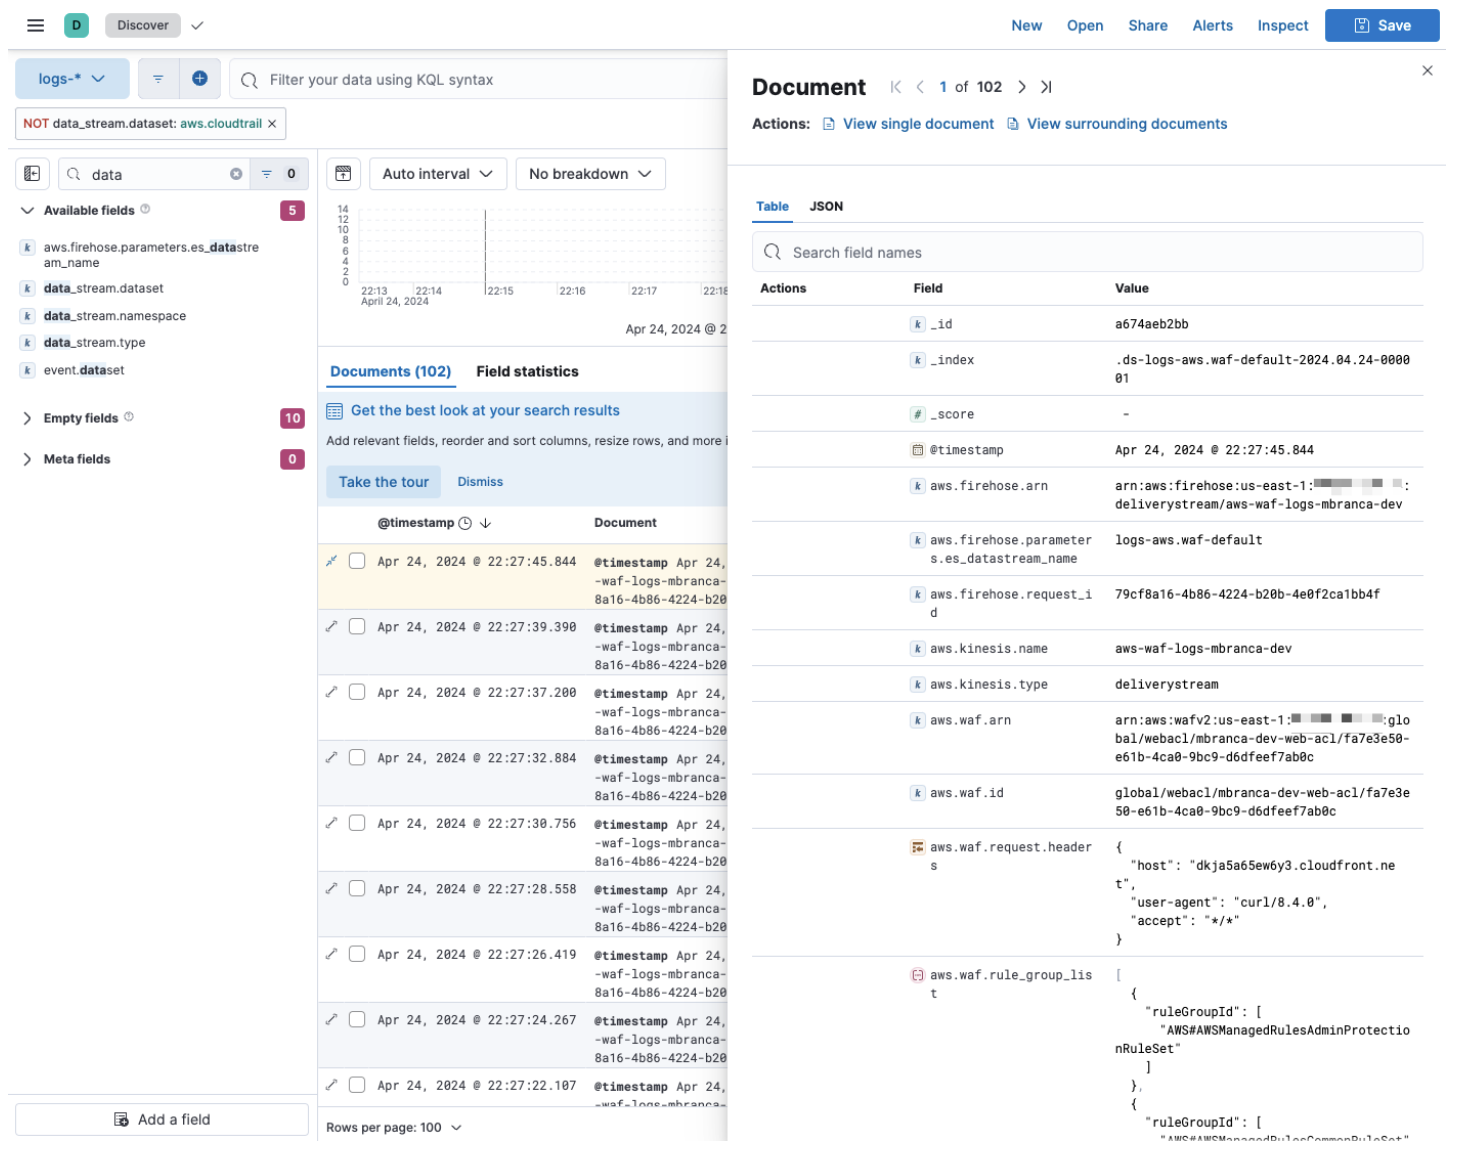
editYou can now log into your Elastic Stack to check if the WAF logs are flowing. To generate logs, you can use cURL to send HTTP requests to your testing CloudFront distribution.
curl -i https://<your cloudfront distribution>.cloudfront.net
To maintain a steady flow of logs, you can use watch -n 5 to repeat the command every 5 seconds.
watch -n 5 curl -i https://<your cloudfront distribution>.cloudfront.net
Navigate to Kibana and visualize the first WAF logs in your Elastic Stack.
