IMPORTANT: No additional bug fixes or documentation updates
will be released for this version. For the latest information, see the
current release documentation.
Step 4: View your data
edit
IMPORTANT: This documentation is no longer updated. Refer to Elastic's version policy and the latest documentation.
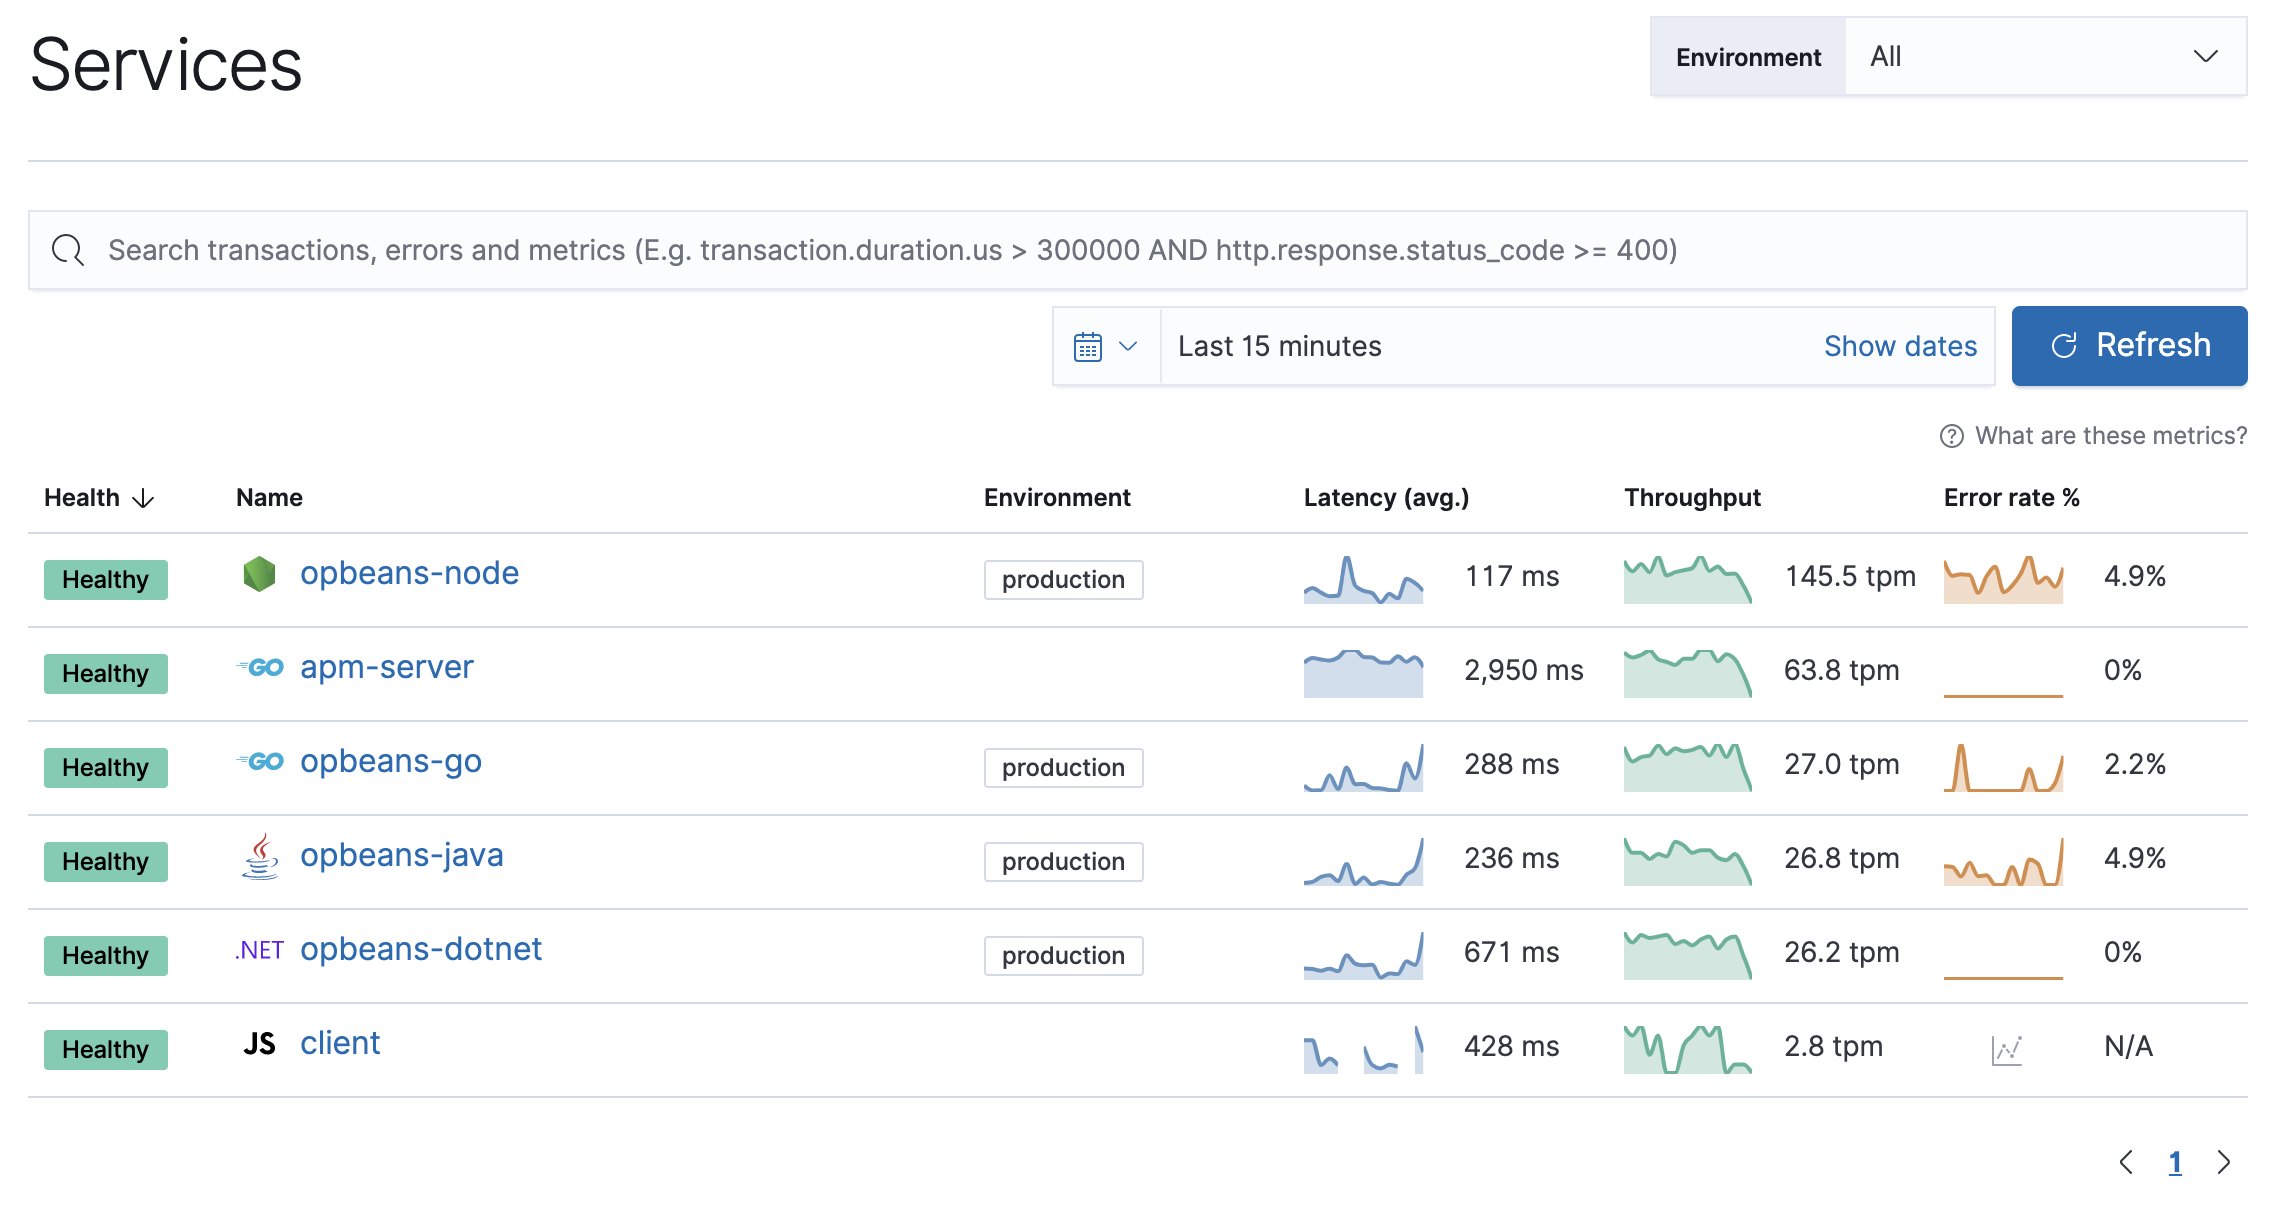
Step 4: View your data
editBack in Kibana, under Observability, select APM. You should see application performance monitoring data flowing into the Elastic Stack!