Observability AI Assistant
editObservability AI Assistant
editThis functionality is in technical preview and may be changed or removed in a future release. Elastic will work to fix any issues, but features in technical preview are not subject to the support SLA of official GA features.
To run the Observability AI Assistant on self-hosted Elastic stack, you need an appropriate license.
The AI Assistant uses generative AI, powered by a connector for OpenAI or Azure OpenAI Service, to provide:
- Contextual insights — open prompts throughout Observability that explain errors and messages and suggest remediation.
- Chat — have conversations with the AI Assistant. Chat uses function calling to request, analyze, and visualize your data.
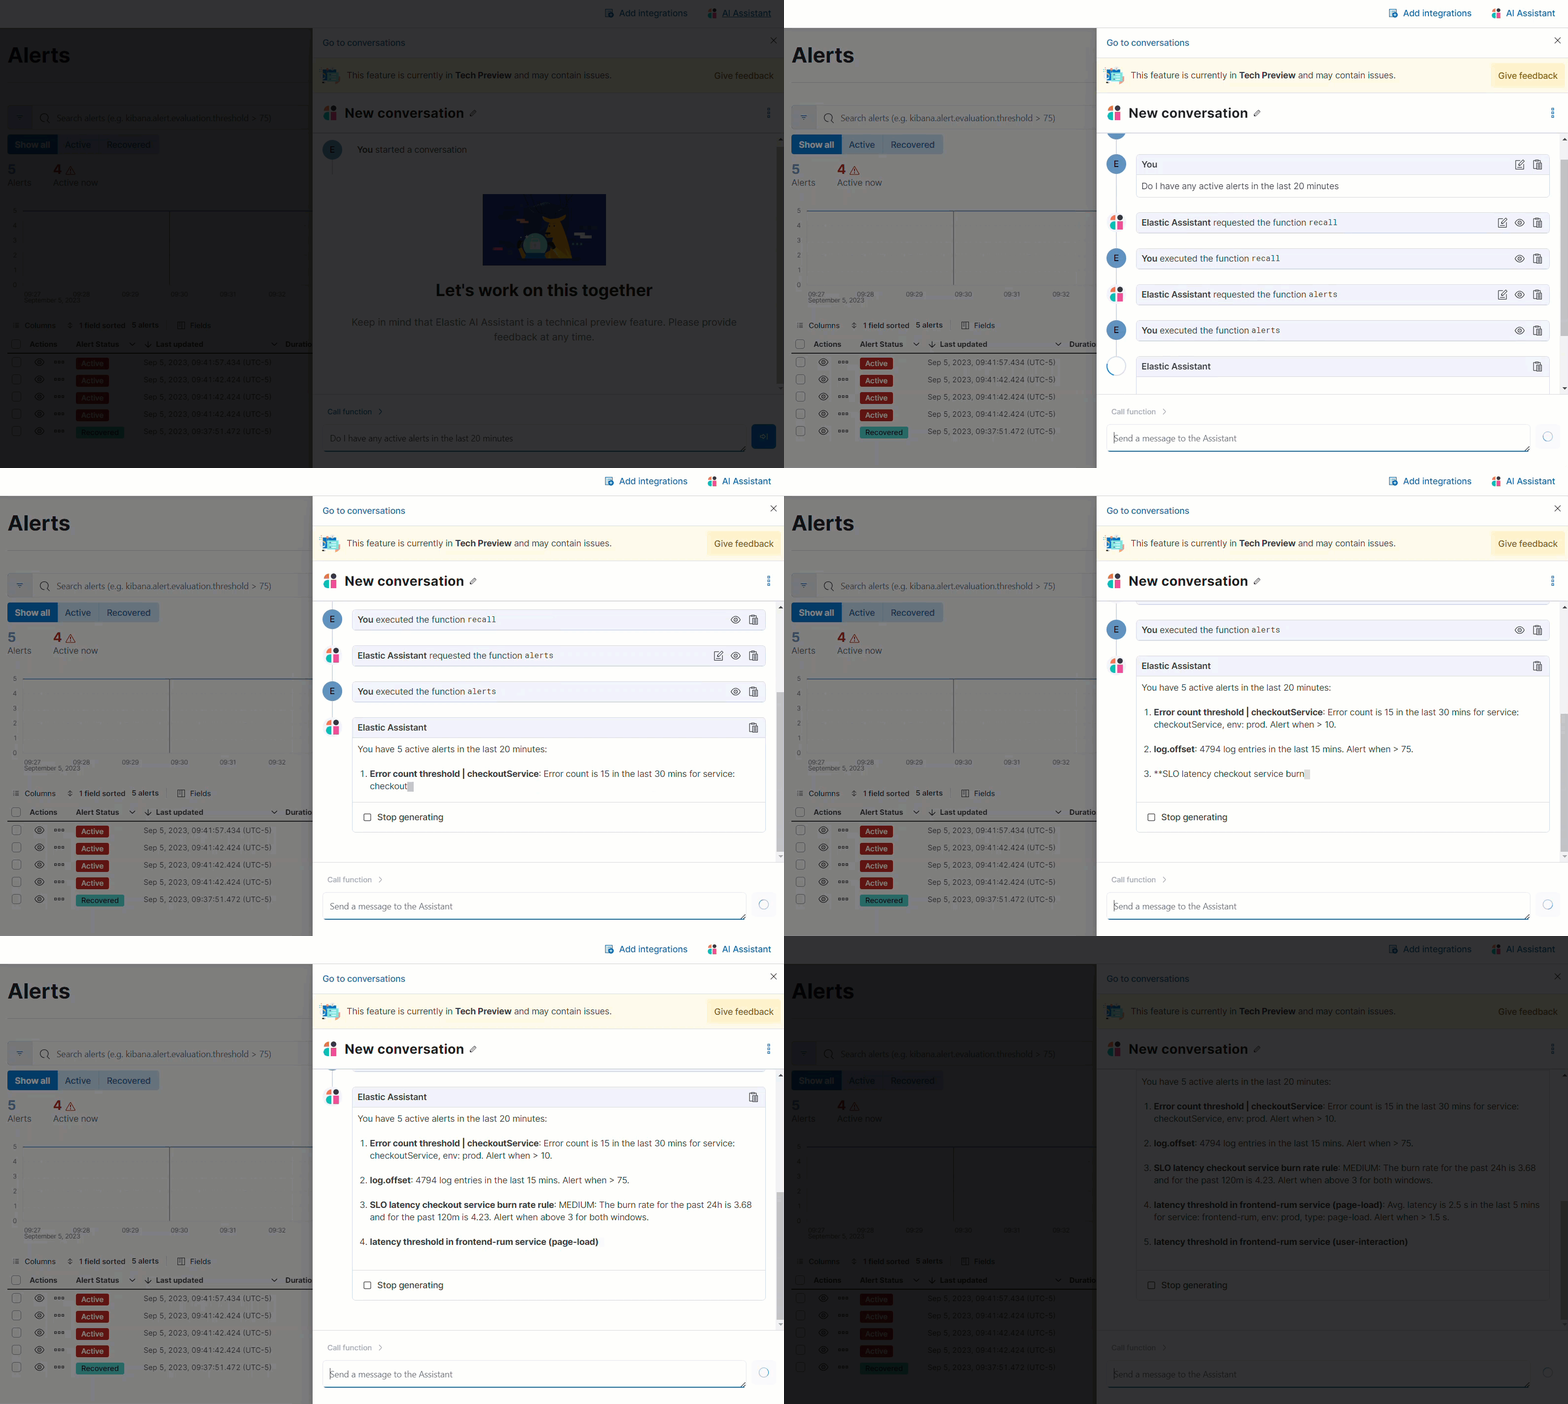
The Observability AI Assistant is in technical preview, and its capabilities are still developing. Users should leverage it sensibly as the reliability of its responses might vary. Always cross-verify any returned advice for accurate threat detection and response, insights, and query generation.
Also, the data you provide to the Observability AI assistant is not anonymized, and is stored and processed by the third-party AI provider. This includes any data used in conversations for analysis or context, such as alert or event data, detection rule configurations, and queries. Therefore, be careful about sharing any confidential or sensitive details while using this feature.
Requirements
editThe AI assistant requires the following:
- Elastic Stack version 8.9 and later.
-
An account with a third-party generative AI provider that supports function calling. The Observability AI Assistant supports the following providers:
-
OpenAI
gpt-4+. -
Azure OpenAI Service
gpt-4(0613) orgpt-4-32k(0613) with API version2023-07-01-previewor more recent.
-
OpenAI
- The knowledge base requires a 4 GB machine learning node.
In Elastic Cloud or Elastic Cloud Enterprise, if you have Machine Learning autoscaling enabled, Machine Learning nodes will be started when using the knowledge base and AI Assistant. Therefore using these features will incur additional costs.
Your data and the AI Assistant
editElastic does not use customer data for model training. This includes anything you send the model, such as alert or event data, detection rule configurations, queries, and prompts. However, any data you provide to the AI Assistant will be processed by the third-party provider you chose when setting up the OpenAI connector as part of the assistant setup.
Elastic does not control third-party tools, and assumes no responsibility or liability for their content, operation, or use, nor for any loss or damage that may arise from your using such tools. Please exercise caution when using AI tools with personal, sensitive, or confidential information. Any data you submit may be used by the provider for AI training or other purposes. There is no guarantee that the provider will keep any information you provide secure or confidential. You should familiarize yourself with the privacy practices and terms of use of any generative AI tools prior to use.
Set up the AI Assistant
editTo set up the AI Assistant:
-
Create an API key from your AI provider to authenticate requests from the AI Assistant. You’ll use this in the next step. Refer to your provider’s documentation for information on generating API keys:
- From Stack Management → Connectors in Kibana, create a Generative AI connector.
-
Authenticate communication between Observability and the AI provider by providing the following information:
- Enter the AI provider’s API endpoint URL in the URL field.
- Enter the API key you created in the previous step in the API Key field.
Add data to the AI Assistant knowledge base
editThe AI Assistant uses ELSER, Elastic’s semantic search engine, to recall data from its internal knowledge base index to create retrieval augmented generation (RAG) responses. Adding data such as Runbooks, GitHub issues, internal documentation, and Slack messages to the knowledge base gives the AI Assistant context to provide more specific assistance.
Your AI provider may collect telemetry when using the AI Assistant. Contact your AI provider for information on how data is collected.
You can add information to the knowledge base by asking the AI Assistant to remember something while chatting (for example, "remember this for next time"). The assistant will create a summary of the information and add it to the knowledge base.
You can also add external data to the knowledge base by completing the following steps:
- Ingest external data (GitHub issues, Markdown files, Jira tickets, text files, etc.) into Elasticsearch using the Elasticsearch Index API.
-
Reindex your data into the AI Assistant’s knowledge base index by completing the following query in Management → Dev Tools in Kibana. Update the following fields before reindexing:
-
InternalDocsIndex— name of the index where your internal documents are stored. -
text_field— name of the field containing your internal documents' text. -
timestamp— name of the timestamp field in your internal documents. -
public— (trueorfalse) iftrue, the document is available to users in the space defined in the followingspacefield or in all spaces if nospaceis defined. Iffalse, the document is restricted to the user indicated in the followinguser.namefield. -
space— (can benull) if defined, restricts the internal document’s availability to a specific Kibana space. -
user.name— (can benull) if defined, restricts the internal document’s availability to a specific user. - You can add a query filter to index specific documents.
-
POST _reindex
{
    "source": {
        "index": "<InternalDocsIndex>",
        "_source": [
            "<text_field>",
            "<timestamp>",
            "namespace",
            "is_correction",
            "public",
            "confidence"
        ]
    },
    "dest": {
        "index": ".kibana-observability-ai-assistant-kb-000001",
        "pipeline": ".kibana-observability-ai-assistant-kb-ingest-pipeline"
    },
    "script": {
        "inline": "ctx._source.text = ctx._source.remove(\"<text_field>\");ctx._source.namespace=\"<space>\";ctx._source.is_correction=false;ctx._source.public=<public>;ctx._source.confidence=\"high\";ctx._source['@timestamp'] = ctx._source.remove(\"<timestamp>\");ctx._source['user.name'] = \"<user.name>\""
    }
}
Interact with the AI Assistant
editYou can chat with the AI Assistant or interact with contextual prompts located throughout Observability. See the following sections for more on interacting with the AI Assistant.
AI Assistant chat
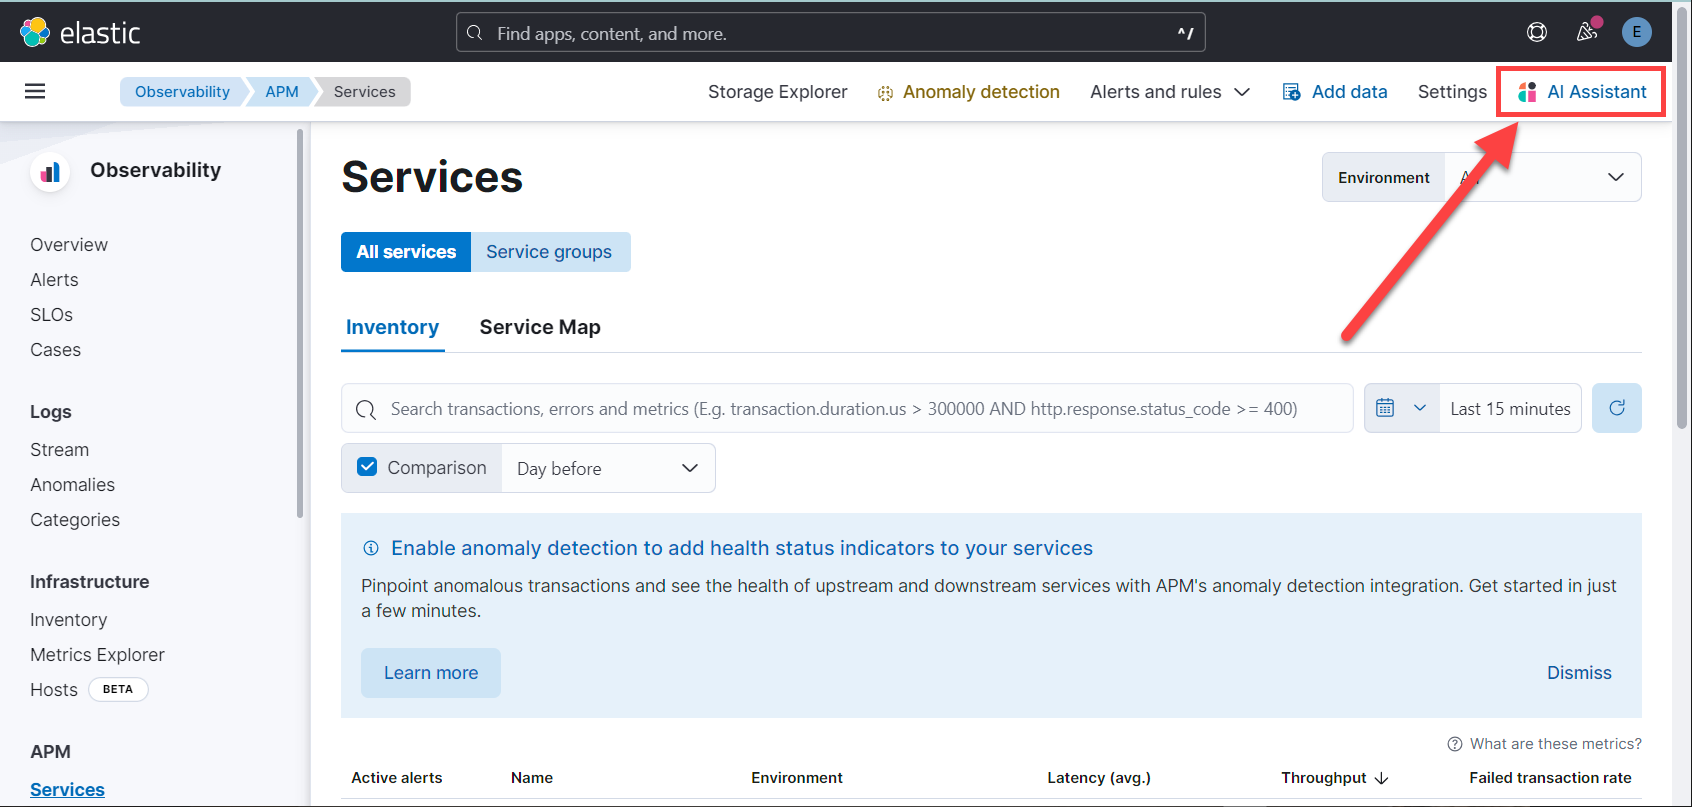
editClick AI Assistant in the upper-right corner of any Observability application to start the chat:
This opens the AI Assistant flyout, where you can ask the assistant questions about your instance:
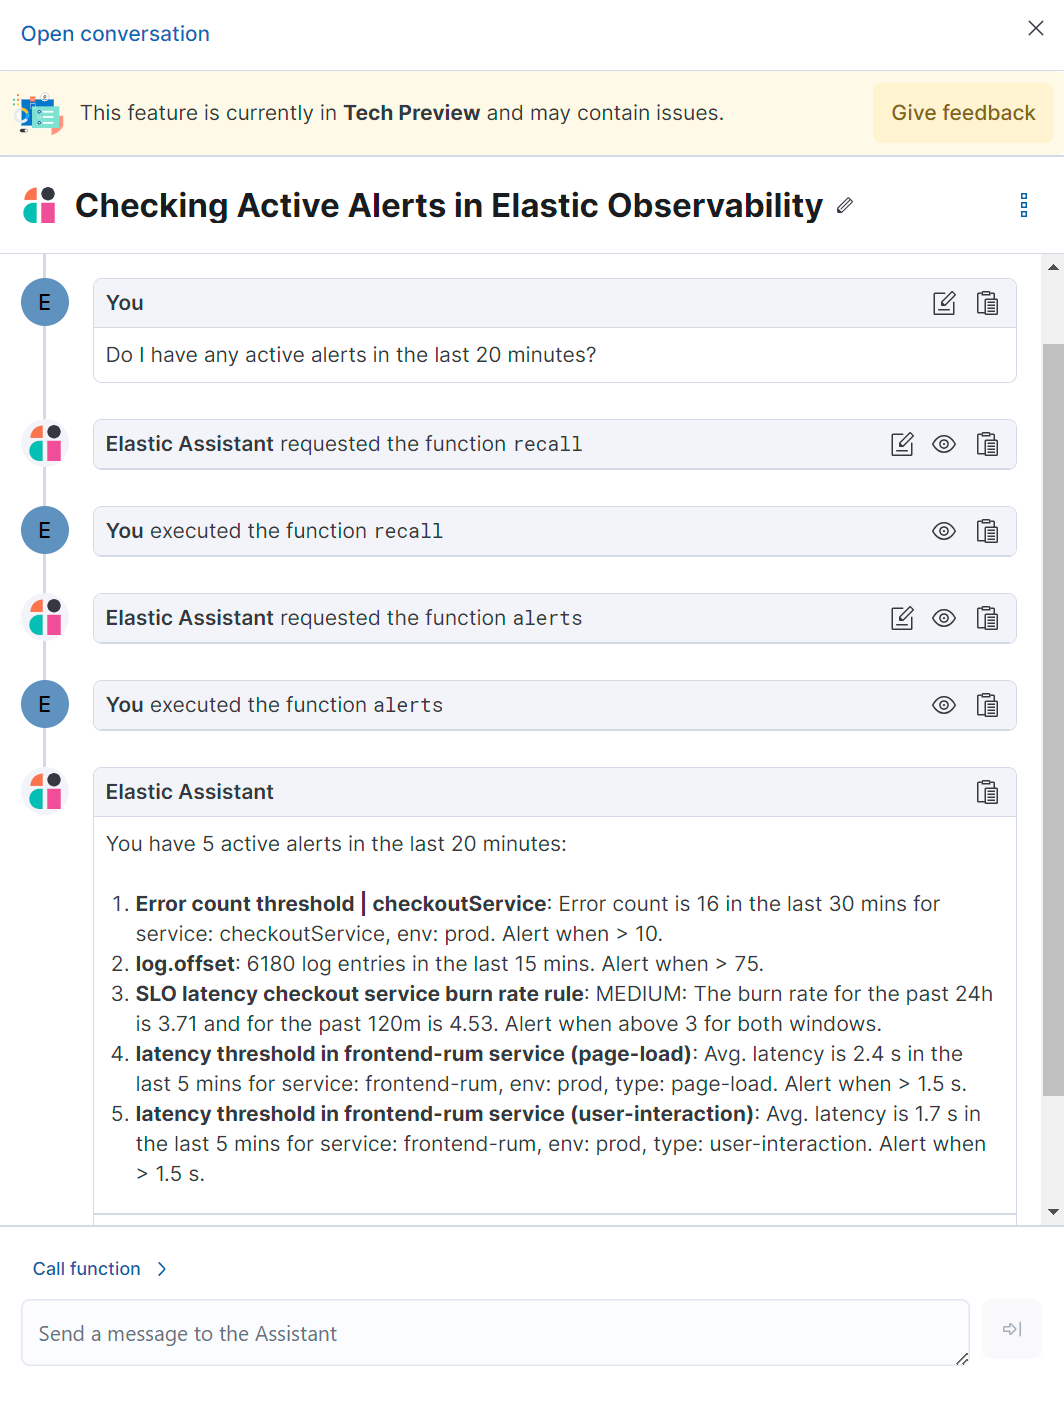
The AI Assistant uses functions to include relevant context in the chat conversation through text, data, and visual components. Both you and the AI Assistant can suggest functions. You can also edit the AI Assistant’s function suggestions and inspect function responses.
The following table lists available functions:
|
|
Summarize parts of the conversation. |
|
|
Recall previous learning. |
|
|
Create custom visualizations, using Lens, that you can add to dashboards. |
|
|
Call Elasticsearch APIs on your behalf. |
|
|
Call Kibana APIs on your behalf. |
|
|
Get alerts for Observability |
|
|
Display different APM metrics (such as throughput, failure rate, or latency) for any service or all services and any or all of their dependencies. Displayed both as a time series and as a single statistic. Additionally, the function returns any changes, such as spikes, step and trend changes, or dips. You can also use it to compare data by requesting two different time ranges, or, for example, two different service versions. |
|
|
Get a sample error document based on the grouping name. This also includes the stacktrace of the error, which might hint to the cause. |
|
|
Get field values that are more prominent in the foreground set than the background set. This can be useful in determining which attributes (such as |
|
|
Get the downstream dependencies (services or uninstrumented backends) for a service. Map the downstream dependency name to a service by returning both |
|
|
Get a summary of a single service, including the language, service version, deployments, the environments, and the infrastructure that it is running in. For example, the number of pods and a list of their downstream dependencies. It also returns active alerts and anomalies. |
|
|
Get the list of monitored services, their health statuses, and alerts. |
AI Assistant contextual prompts
editAI Assistant contextual prompts throughout Observability provide the following information:
- Universal Profiling — explains the most expensive libraries and functions in your fleet and provides optimization suggestions.
- Application performance monitoring (APM) — explains APM errors and provides remediation suggestions.
- Infrastructure Observability — explains the processes running on a host.
- Logs — explains log messages and generates search patterns to find similar issues.
- Alerting — provides possible causes and remediation suggestions for log rate changes.
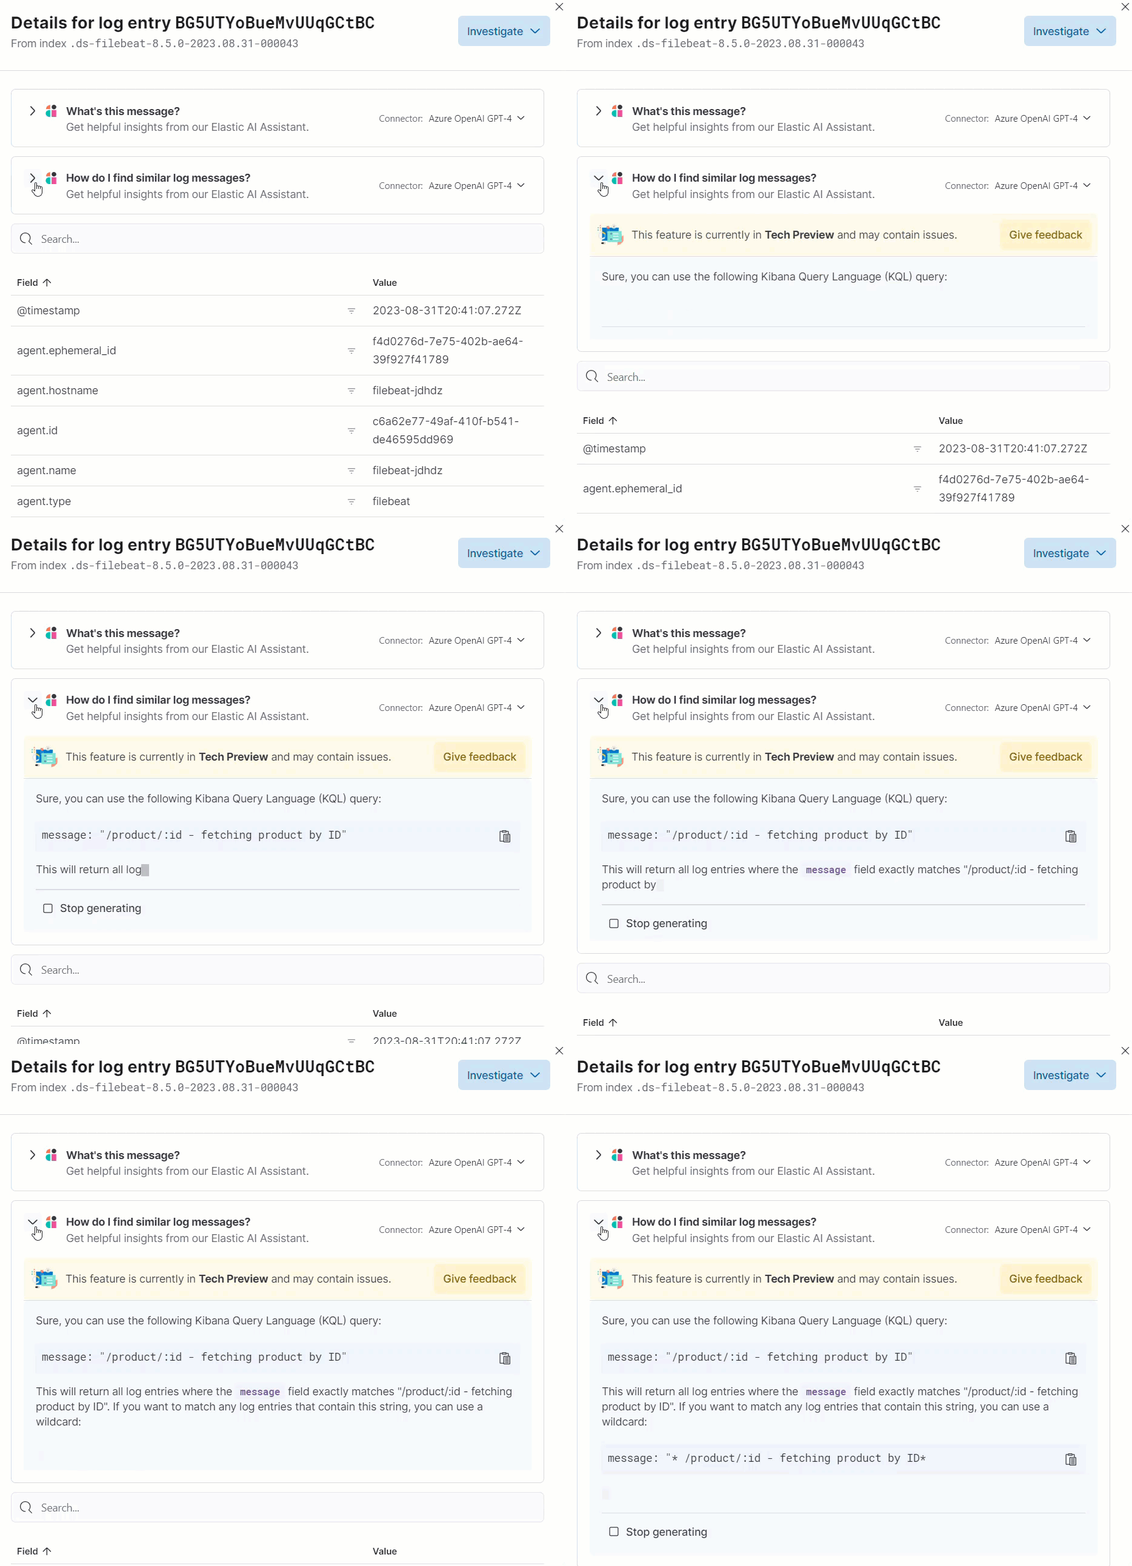
For example, in the log details, you’ll see prompts for What’s this message? and How do I find similar log messages?:
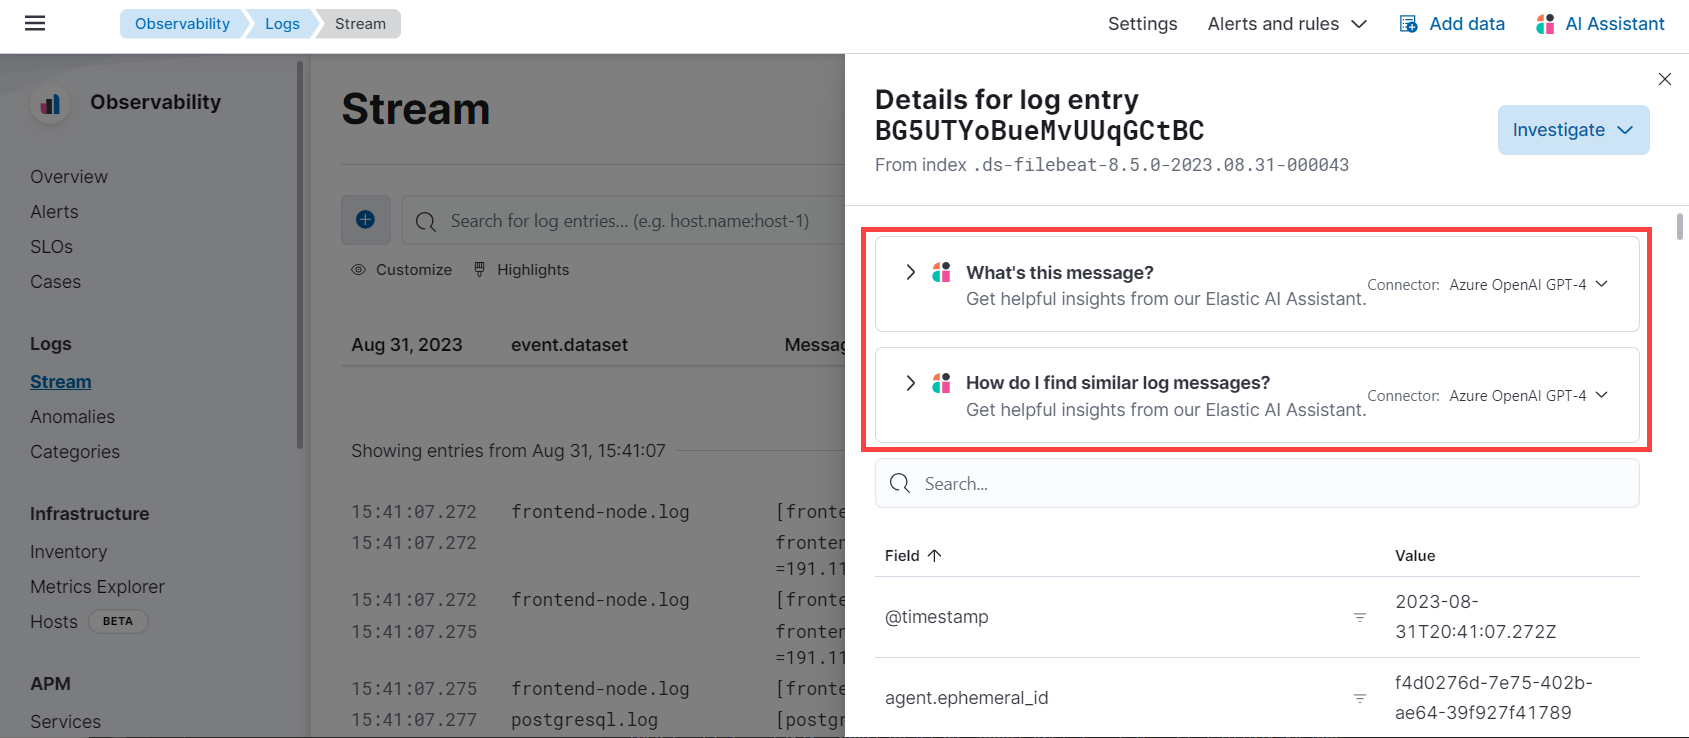
Clicking a prompt generates a message specific to that log entry:
You can continue a conversation from a contextual prompt by clicking Start chat to open the AI Assistant chat.