- Logstash Reference: other versions:
- Logstash Introduction
- Getting Started with Logstash
- How Logstash Works
- Setting Up and Running Logstash
- Logstash Directory Layout
- Logstash Configuration Files
- logstash.yml
- Secrets keystore for secure settings
- Running Logstash from the Command Line
- Running Logstash as a Service on Debian or RPM
- Running Logstash on Docker
- Configuring Logstash for Docker
- Running Logstash on Windows
- Logging
- Shutting Down Logstash
- Installing X-Pack
- Setting Up X-Pack
- Upgrading Logstash
- Configuring Logstash
- Structure of a Config File
- Accessing Event Data and Fields in the Configuration
- Using Environment Variables in the Configuration
- Logstash Configuration Examples
- Multiple Pipelines
- Pipeline-to-Pipeline Communication (Beta)
- Reloading the Config File
- Managing Multiline Events
- Glob Pattern Support
- Converting Ingest Node Pipelines
- Logstash-to-Logstash Communication
- Centralized Pipeline Management
- X-Pack monitoring
- X-Pack security
- X-Pack Settings
- Managing Logstash
- Working with Logstash Modules
- Working with Filebeat Modules
- Data Resiliency
- Transforming Data
- Deploying and Scaling Logstash
- Performance Tuning
- Monitoring Logstash
- Monitoring APIs
- Working with plugins
- Input plugins
- azure_event_hubs
- beats
- cloudwatch
- couchdb_changes
- dead_letter_queue
- elasticsearch
- exec
- file
- ganglia
- gelf
- generator
- github
- google_cloud_storage
- google_pubsub
- graphite
- heartbeat
- http
- http_poller
- imap
- irc
- jdbc
- jms
- jmx
- kafka
- kinesis
- log4j
- lumberjack
- meetup
- pipe
- puppet_facter
- rabbitmq
- redis
- relp
- rss
- s3
- salesforce
- snmp
- snmptrap
- sqlite
- sqs
- stdin
- stomp
- syslog
- tcp
- udp
- unix
- varnishlog
- websocket
- wmi
- xmpp
- Output plugins
- boundary
- circonus
- cloudwatch
- csv
- datadog
- datadog_metrics
- elastic_app_search
- elasticsearch
- exec
- file
- ganglia
- gelf
- google_bigquery
- google_pubsub
- graphite
- graphtastic
- http
- influxdb
- irc
- juggernaut
- kafka
- librato
- loggly
- lumberjack
- metriccatcher
- mongodb
- nagios
- nagios_nsca
- opentsdb
- pagerduty
- pipe
- rabbitmq
- redis
- redmine
- riak
- riemann
- s3
- sns
- solr_http
- sqs
- statsd
- stdout
- stomp
- syslog
- tcp
- timber
- udp
- webhdfs
- websocket
- xmpp
- zabbix
- Filter plugins
- aggregate
- alter
- cidr
- cipher
- clone
- csv
- date
- de_dot
- dissect
- dns
- drop
- elapsed
- elasticsearch
- environment
- extractnumbers
- fingerprint
- geoip
- grok
- http
- i18n
- jdbc_static
- jdbc_streaming
- json
- json_encode
- kv
- memcached
- metricize
- metrics
- mutate
- prune
- range
- ruby
- sleep
- split
- syslog_pri
- threats_classifier
- throttle
- tld
- translate
- truncate
- urldecode
- useragent
- uuid
- xml
- Codec plugins
- Tips and Best Practices
- Troubleshooting Common Problems
- Contributing to Logstash
- How to write a Logstash input plugin
- How to write a Logstash codec plugin
- How to write a Logstash filter plugin
- How to write a Logstash output plugin
- Documenting your plugin
- Contributing a Patch to a Logstash Plugin
- Logstash Plugins Community Maintainer Guide
- Submitting your plugin to RubyGems.org and the logstash-plugins repository
- Contributing a Java Plugin
- Glossary of Terms
- Breaking Changes
- Release Notes
- Logstash 6.8.23 Release Notes
- Logstash 6.8.22 Release Notes
- Logstash 6.8.21 Release Notes
- Logstash 6.8.20 Release Notes
- Logstash 6.8.19 Release Notes
- Logstash 6.8.18 Release Notes
- Logstash 6.8.17 Release Notes
- Logstash 6.8.16 Release Notes
- Logstash 6.8.15 Release Notes
- Logstash 6.8.14 Release Notes
- Logstash 6.8.13 Release Notes
- Logstash 6.8.12 Release Notes
- Logstash 6.8.11 Release Notes
- Logstash 6.8.10 Release Notes
- Logstash 6.8.9 Release Notes
- Logstash 6.8.8 Release Notes
- Logstash 6.8.7 Release Notes
- Logstash 6.8.6 Release Notes
- Logstash 6.8.5 Release Notes
- Logstash 6.8.4 Release Notes
- Logstash 6.8.3 Release Notes
- Logstash 6.8.2 Release Notes
- Logstash 6.8.1 Release Notes
- Logstash 6.8.0 Release Notes
- Logstash 6.7.2 Release Notes
- Logstash 6.7.1 Release Notes
- Logstash 6.7.0 Release Notes
- Logstash 6.6.2 Release Notes
- Logstash 6.6.1 Release Notes
- Logstash 6.6.0 Release Notes
- Logstash 6.5.4 Release Notes
- Logstash 6.5.3 Release Notes
- Logstash 6.5.2 Release Notes
- Logstash 6.5.1 Release Notes
- Logstash 6.5.0 Release Notes
- Logstash 6.4.3 Release Notes
- Logstash 6.4.2 Release Notes
- Logstash 6.4.1 Release Notes
- Logstash 6.4.0 Release Notes
- Logstash 6.3.2 Release Notes
- Logstash 6.3.1 Release Notes
- Logstash 6.3.0 Release Notes
- Logstash 6.2.4 Release Notes
- Logstash 6.2.3 Release Notes
- Logstash 6.2.2 Release Notes
- Logstash 6.2.1 Release Notes
- Logstash 6.2.0 Release Notes
- Logstash 6.1.3 Release Notes
- Logstash 6.1.2 Release Notes
- Logstash 6.1.1 Release Notes
- Logstash 6.1.0 Release Notes
Pipeline Viewer UI
editPipeline Viewer UI
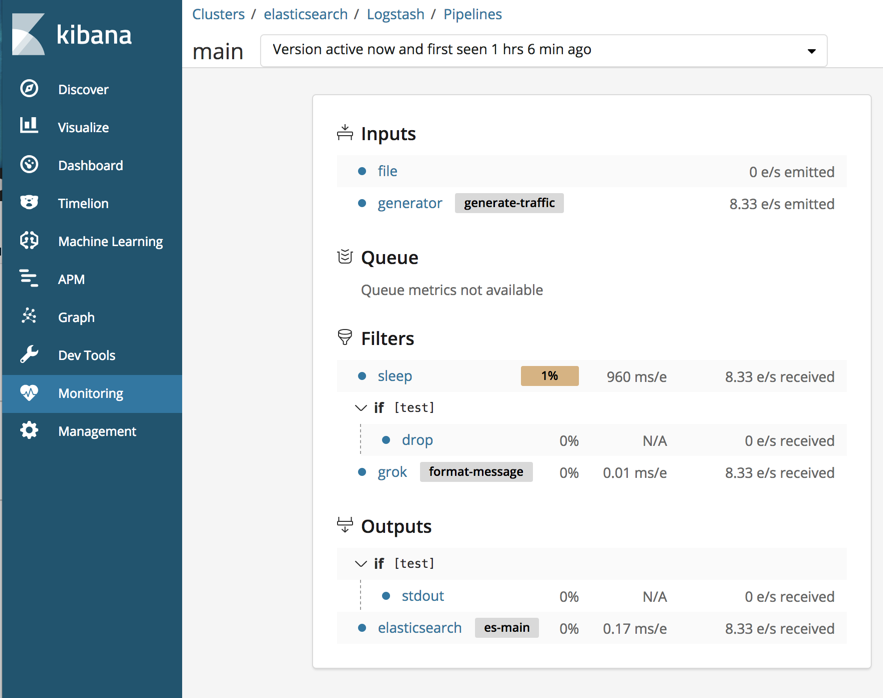
editUse the pipeline viewer to visualize and monitor the behavior of complex Logstash pipeline configurations. You can see and interact with a tree view that illustrates the pipeline topology, data flow, and branching logic.
The pipeline viewer highlights CPU% and event latency in cases where the values are anomalous. This information helps you quickly identify processing that is disproportionately slow.
Prerequisites
editBefore using the pipeline viewer:
- Configure Logstash monitoring.
- Start the Logstash pipeline that you want to monitor.
Logstash begins shipping metrics to the monitoring cluster.
View the pipeline
editTo view the pipeline:
- Kibana → Monitoring → Logstash → Pipelines
Each pipeline is identified by a pipeline ID (main
by default). For each
pipeline, you see the pipeline’s throughput and the number
of nodes on which the pipeline is running during the selected time range.
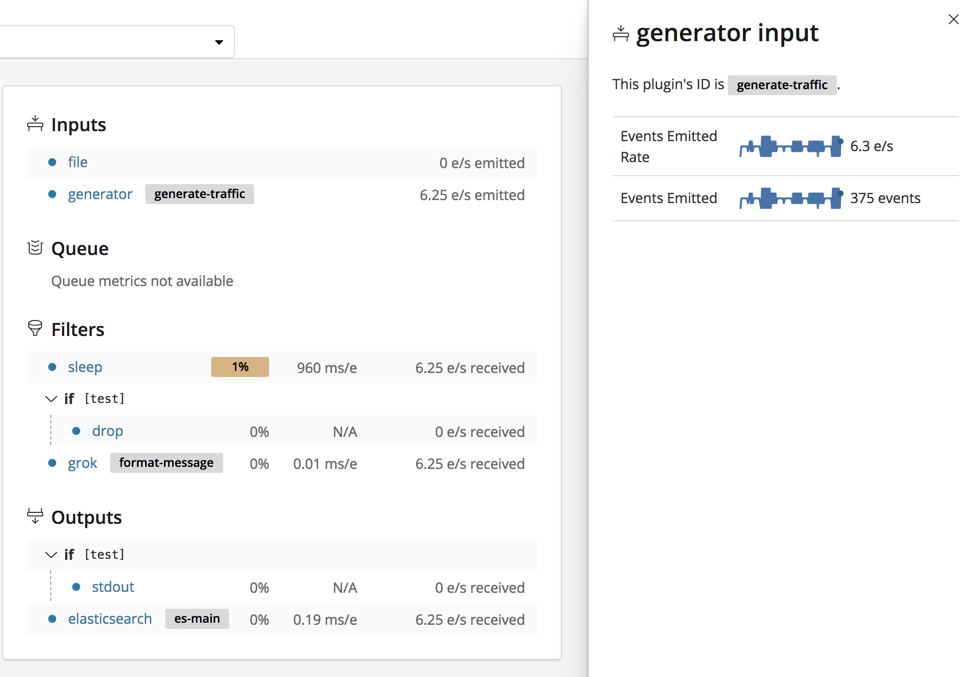
Many elements in the tree are clickable. For example, you can click the plugin name to expand the detail view.
Click the arrow beside a branch name to collapse or expand it.
Notes and best practices
editUse semantic IDs.
Specify semantic IDs when you configure the stages in your Logstash pipeline.
Otherwise, Logstash generates them for you. Semantic IDs help you identify
configurations that are causing bottlenecks. For example, you may have several
grok filters running in your pipeline. If you have specified semantic IDs, you
can tell at a glance which filters are slow. Semantic IDs, such as
apacheParsingGrok
and cloudwatchGrok
, point you to the grok filters that are
causing bottlenecks.
Outliers. Values and stats that are anomalously slow or otherwise out of line are highlighted. This doesn’t necessarily indicate a problem, but it highlights potential bottle necks so that you can find them quickly.
Some plugins are slower than others due to the nature of the work they do. For instance, you may find that a grok filter that uses a complicated regexp runs a lot slower than a mutate filter that simply adds a field. The grok filter might be highlighted in this case, though it may not be possible to further optimize its work.
Versioning. Version information is available from the dropdown list beside the pipeline ID. Logstash generates a new version each time you modify a pipeline, and stores multiple versions of the pipeline stats. Use this information to see how changes over time affect throughput and other metrics. Logstash does not store multiple versions of the pipeline configurations.