This documentation contains work-in-progress information for future Elastic Stack and Cloud releases. Use the version selector to view supported release docs. It also contains some Elastic Cloud serverless information. Check out our serverless docs for more details.
Field statistics
editField statistics
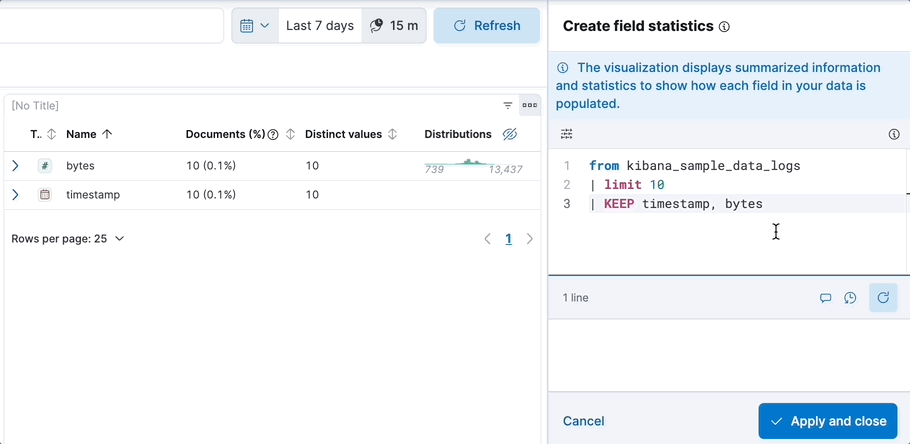
editField statistics panels allow you to display a table with additional field information in your dashboards, such as document count, values, and distribution.
- From your dashboard, select Add panel.
-
Choose Field statistics under Visualizations. An ES|QL editor appears and lets you configure your query with the fields and information that you want to show.
Check the ES|QL reference to get familiar with the syntax and optimize your query.
-
When editing your query or its configuration, run the query to update the preview of the visualization.
- Select Apply and close to save the visualization to the dashboard.