- Kibana Guide: other versions:
- What is Kibana?
- What’s new in 8.7
- Kibana concepts
- Quick start
- Set up
- Install Kibana
- Configure Kibana
- Alerting and action settings
- APM settings
- Banners settings
- Enterprise Search settings
- Fleet settings
- i18n settings
- Logging settings
- Logs settings
- Metrics settings
- Monitoring settings
- Reporting settings
- Search sessions settings
- Secure settings
- Security settings
- Spaces settings
- Task Manager settings
- Telemetry settings
- URL drilldown settings
- Start and stop Kibana
- Access Kibana
- Securing access to Kibana
- Add data
- Upgrade Kibana
- Configure security
- Configure reporting
- Configure logging
- Configure monitoring
- Command line tools
- Production considerations
- Discover
- Dashboard and visualizations
- Canvas
- Maps
- Build a map to compare metrics by country or region
- Track, visualize, and alert on assets in real time
- Map custom regions with reverse geocoding
- Heat map layer
- Tile layer
- Vector layer
- Plot big data
- Search geographic data
- Configure map settings
- Connect to Elastic Maps Service
- Import geospatial data
- Troubleshoot
- Reporting and sharing
- Machine learning
- Graph
- Alerting
- Observability
- APM
- Security
- Dev Tools
- Fleet
- Osquery
- Stack Monitoring
- Stack Management
- REST API
- Get features API
- Kibana spaces APIs
- Kibana role management APIs
- User session management APIs
- Saved objects APIs
- Data views API
- Index patterns APIs
- Alerting APIs
- Action and connector APIs
- Cases APIs
- Add comment
- Create case
- Delete cases
- Delete comments
- Find case activity
- Find cases
- Find connectors
- Get alerts
- Get case activity
- Get case
- Get case status
- Get cases by alert
- Get comments
- Get configuration
- Get reporters
- Get tags
- Push case
- Set configuration
- Update cases
- Update comment
- Update configuration
- Import and export dashboard APIs
- Logstash configuration management APIs
- Machine learning APIs
- Osquery manager API
- Short URLs APIs
- Get Task Manager health
- Upgrade assistant APIs
- Kibana plugins
- Troubleshooting
- Accessibility
- Release notes
- Developer guide
Anomaly detection
editAnomaly detection
editThe Elastic machine learning anomaly detection feature automatically models the normal behavior of your time series data — learning trends, periodicity, and more — in real time to identify anomalies, streamline root cause analysis, and reduce false positives. Anomaly detection runs in and scales with Elasticsearch, and includes an intuitive UI on the Kibana Machine Learning page for creating anomaly detection jobs and understanding results.
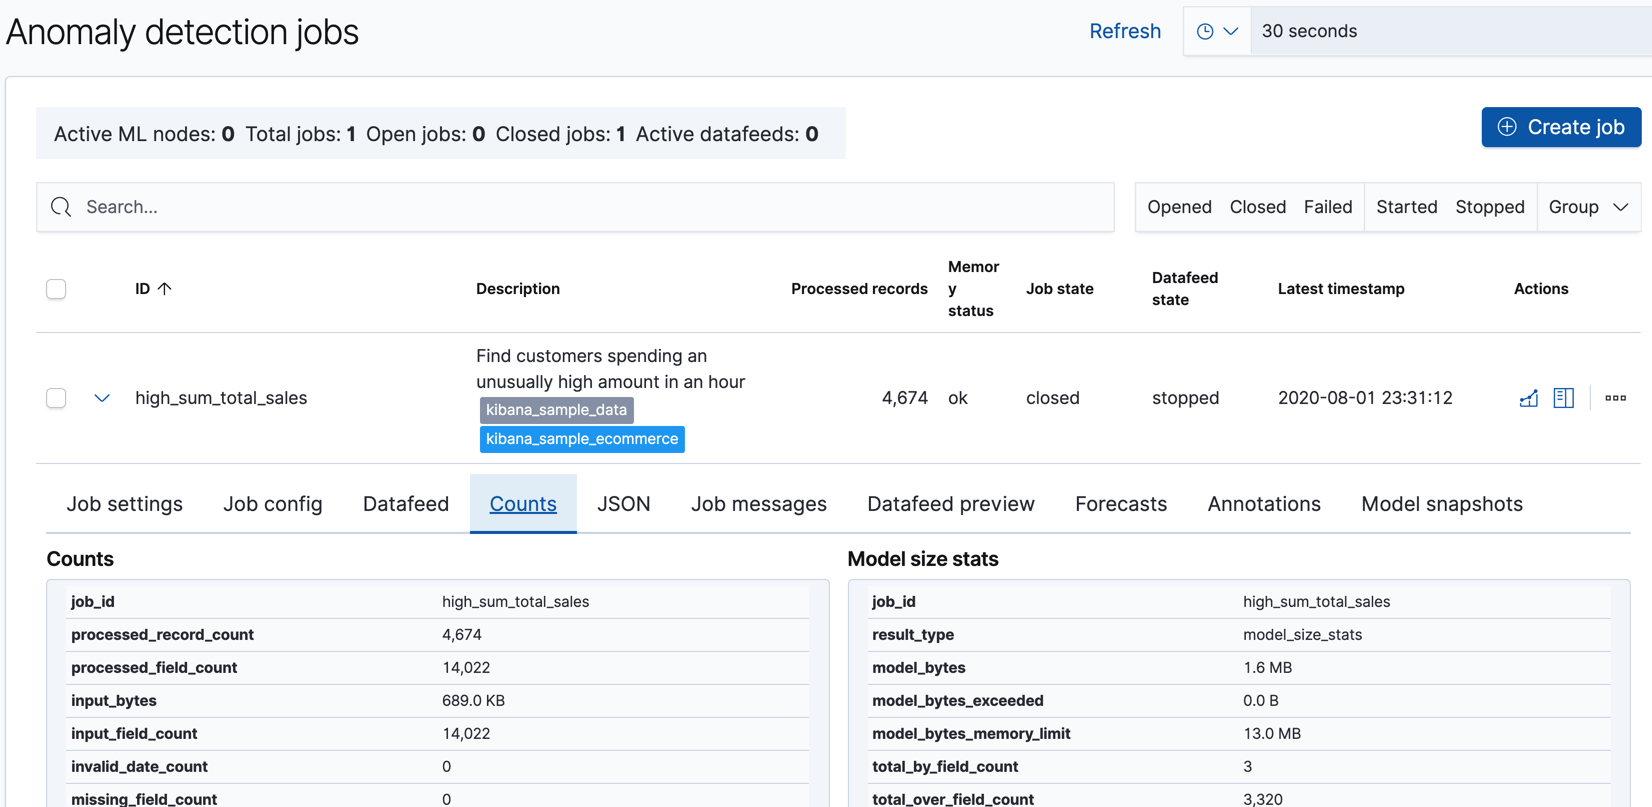
If you have a license that includes the machine learning features, you can create anomaly detection jobs and manage jobs and datafeeds from the Job Management pane:
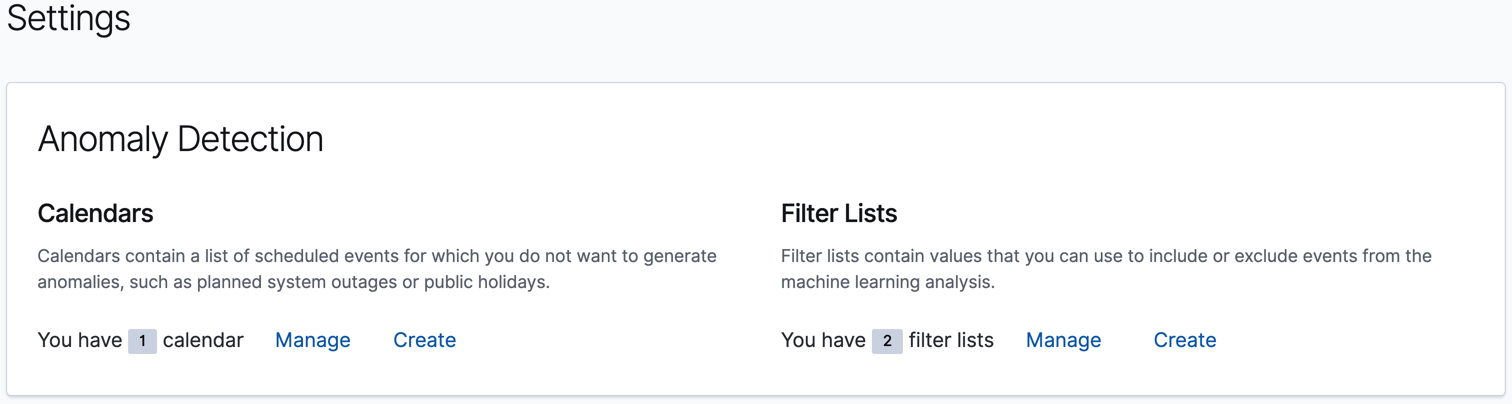
You can use the Settings pane to create and edit calendars and the filters that are used in custom rules:
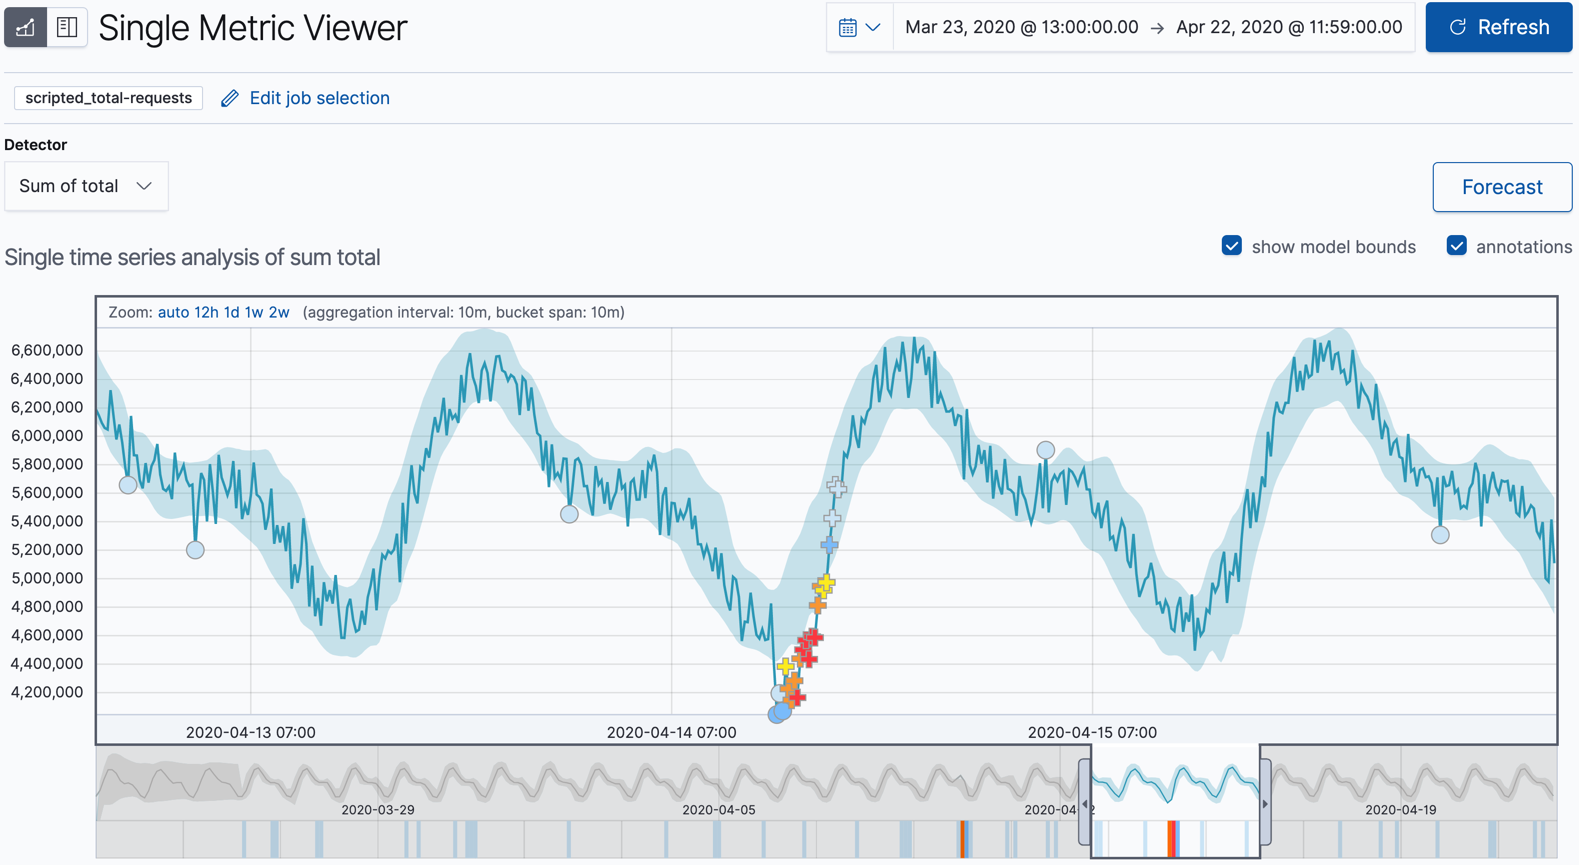
The Anomaly Explorer and Single Metric Viewer display the results of your anomaly detection jobs. For example:
You can optionally add annotations by drag-selecting a period of time in the Single Metric Viewer and adding a description. For example, you can add an explanation for anomalies in that time period or provide notes about what is occurring in your operational environment at that time:
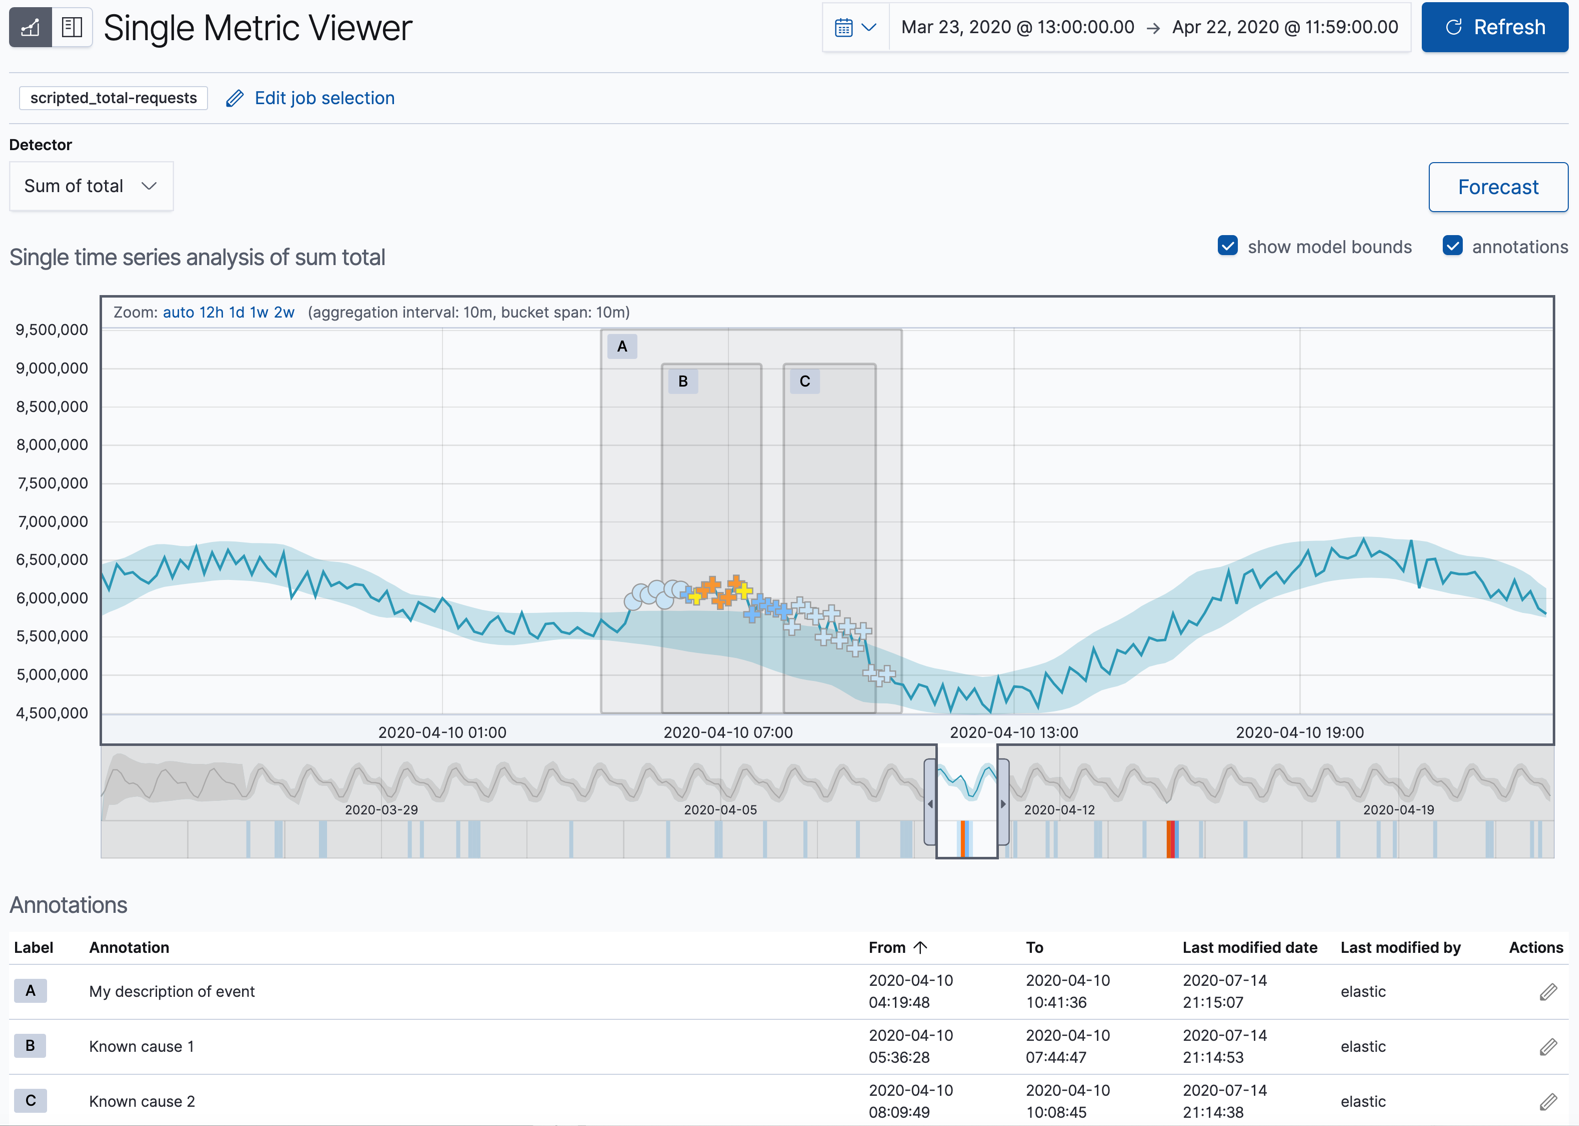
In some circumstances, annotations are also added automatically. For example, if the anomaly detection job detects that there is missing data, it annotates the affected time period. For more information, see Handling delayed data. The Job Management pane shows the full list of annotations for each job.
The Kibana machine learning features use pop-ups. You must configure your web browser so that it does not block pop-up windows or create an exception for your Kibana URL.
For more information about the anomaly detection feature, see Machine learning in the Elastic Stack and Machine learning anomaly detection.