Connectors
editConnectors
editConnectors provide a central place to store connection information for services and integrations with third party systems. Actions are instantiations of a connector that are linked to rules and run as background tasks on the Kibana server when rule conditions are met. Kibana provides the following types of connectors:
Send email from your server. |
|
Create an incident in IBM Resilient. |
|
Index data into Elasticsearch. |
|
Create an incident in Jira. |
|
Send a message to a Microsoft Teams channel. |
|
Create or close an alert in Opsgenie. |
|
Send an event in PagerDuty. |
|
Add a message to a Kibana log. |
|
Create an incident in ServiceNow. |
|
Create a security incident in ServiceNow. |
|
Create an event in ServiceNow. |
|
Send a message to a Slack channel or user. |
|
Create an incident in Swimlane. |
|
Send events to a Tines Story. |
|
Send a request to a web service. |
|
Send a request to a Case Management web service. |
|
Send actionable alerts to on-call xMatters resources. |
|
Trigger a Torq workflow. |
Some connector types are paid commercial features, while others are free. For a comparison of the Elastic subscription levels, go to the subscription page.
Managing connectors
editRules use connectors to route actions to different destinations like log files, ticketing systems, and messaging tools. While each Kibana app can offer their own types of rules, they typically share connectors. Stack Management > Connectors offers a central place to view and manage all the connectors in the current space.
Required permissions
editAccess to connectors is granted based on your privileges to alerting-enabled features. For more information, go to Security.
Connector networking configuration
editUse the action configuration settings to customize connector networking configurations, such as proxies, certificates, or TLS settings. You can set configurations that apply to all your connectors or use xpack.actions.customHostSettings to set per-host configurations.
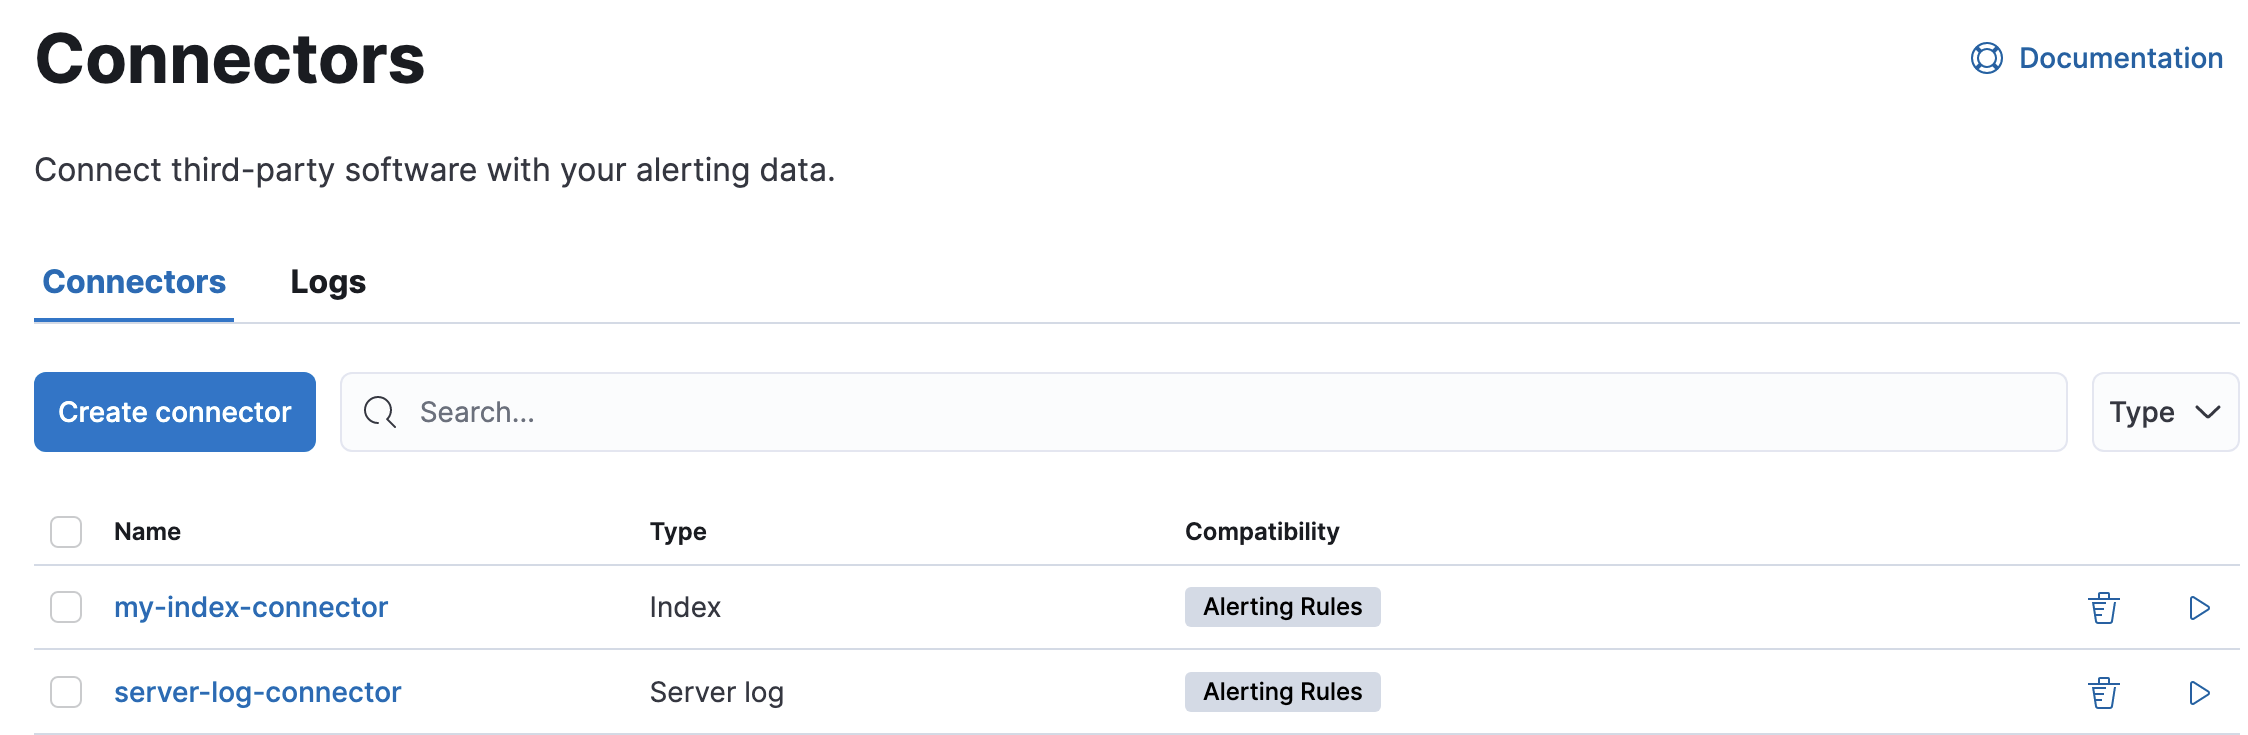
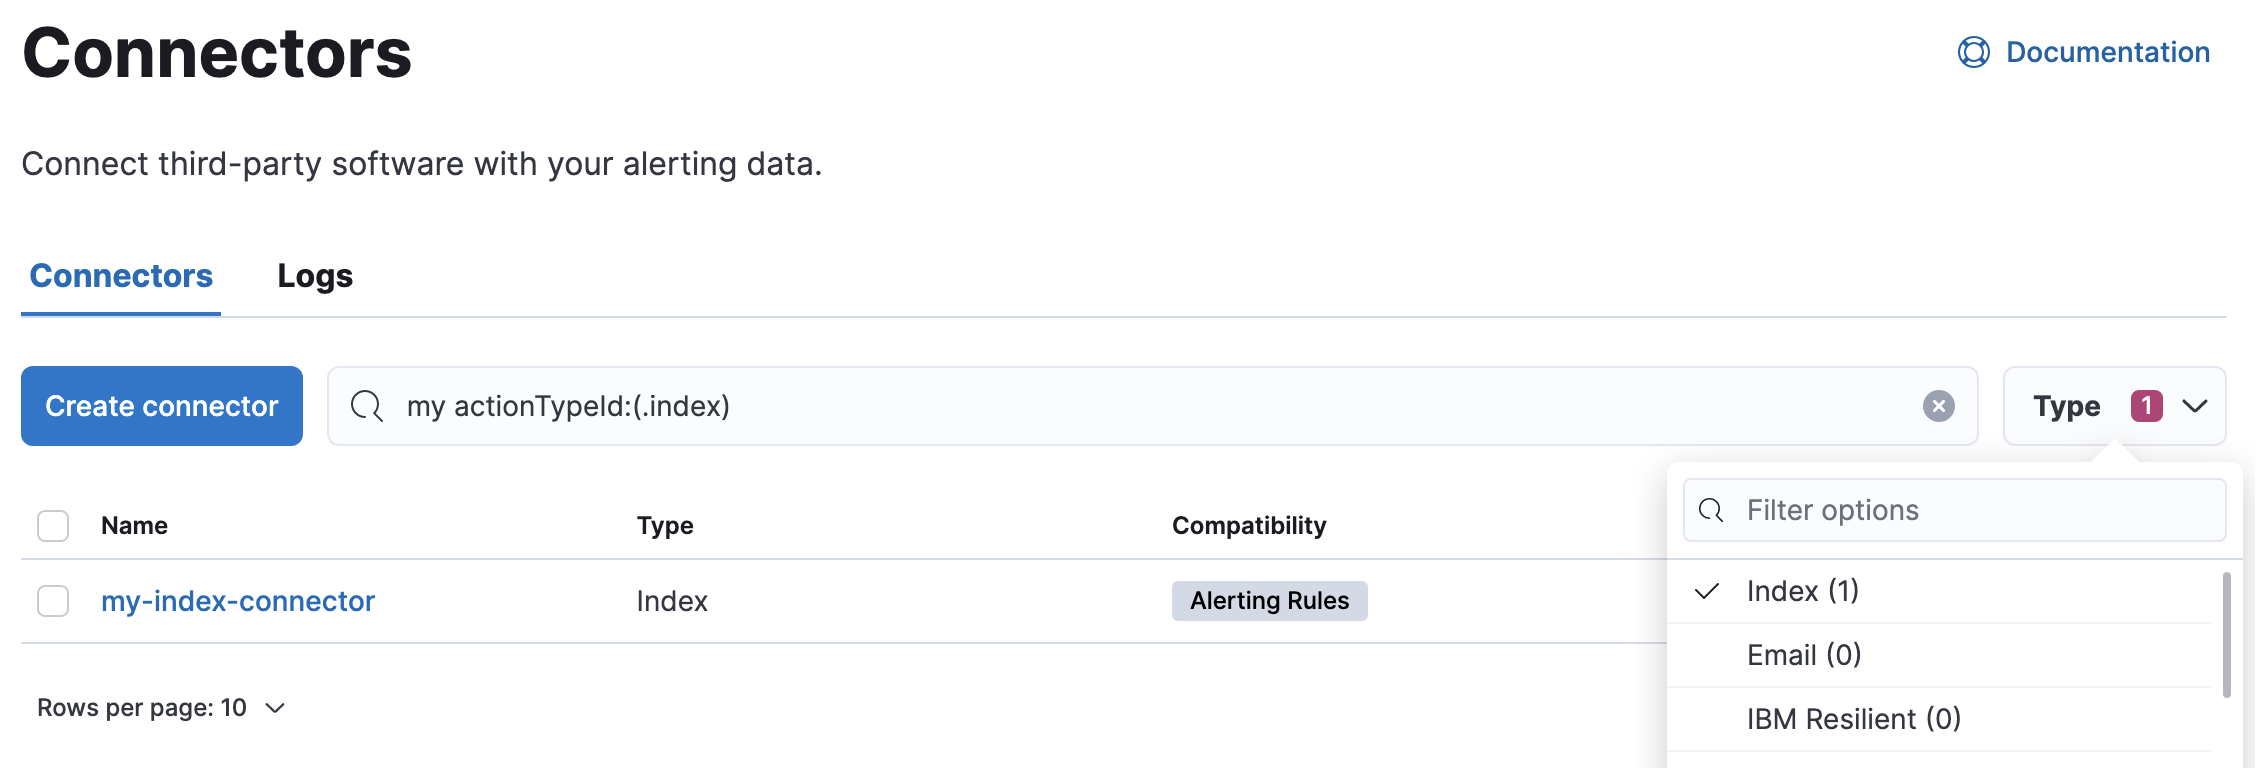
Connector list
editIn Stack Management > Connectors, you can find a list of the connectors in the current space. You can use the search bar to find specific connectors by name and type. The Type dropdown also enables you to filter to a subset of connector types.
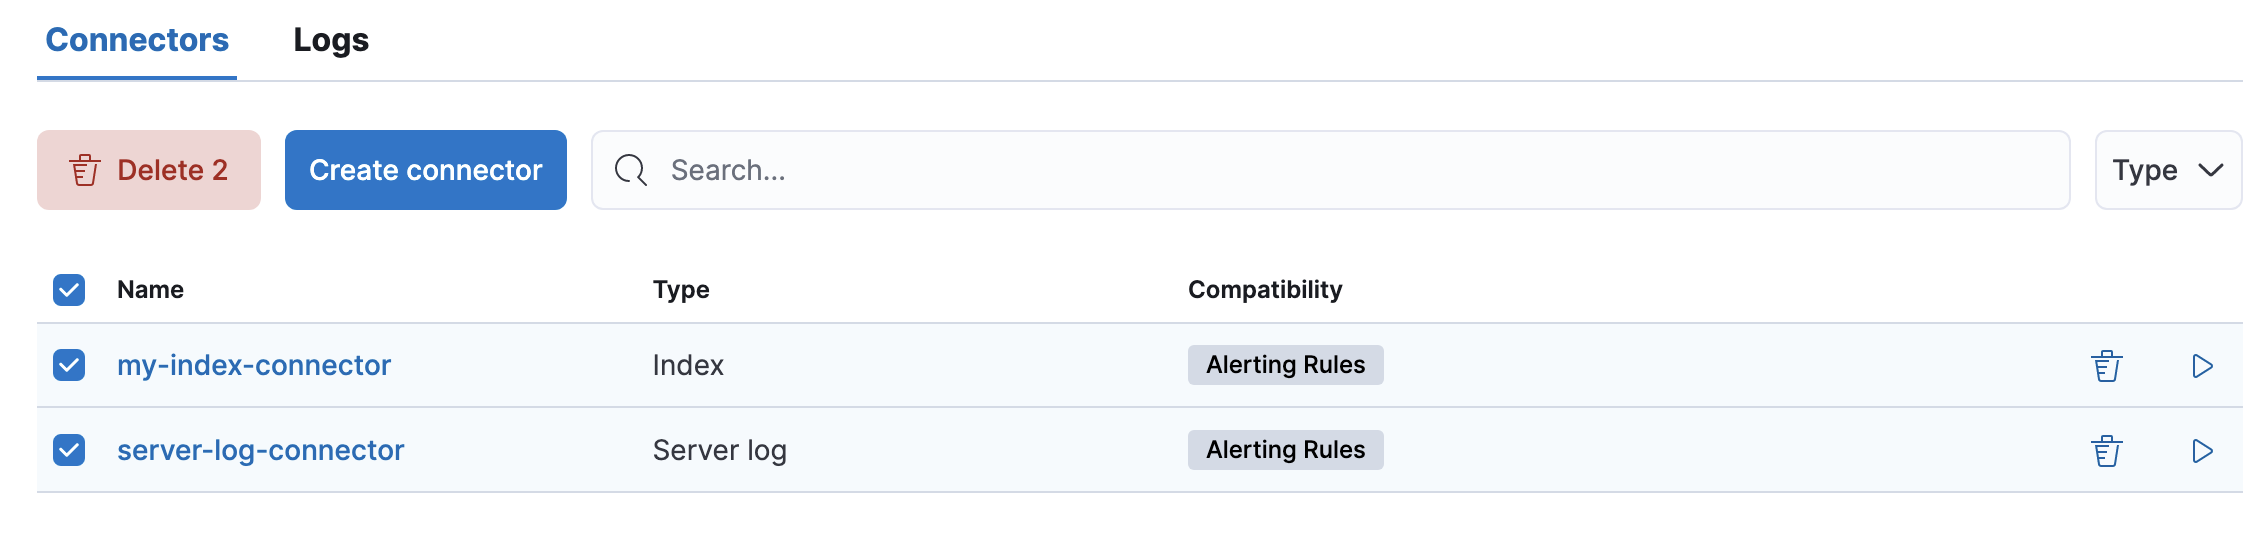
You can delete individual connectors using the trash icon. Alternatively, select multiple connectors and delete them in bulk using the Delete button.
You can delete a connector even if there are still actions referencing it. When this happens the action will fail to run and errors appear in the Kibana logs.
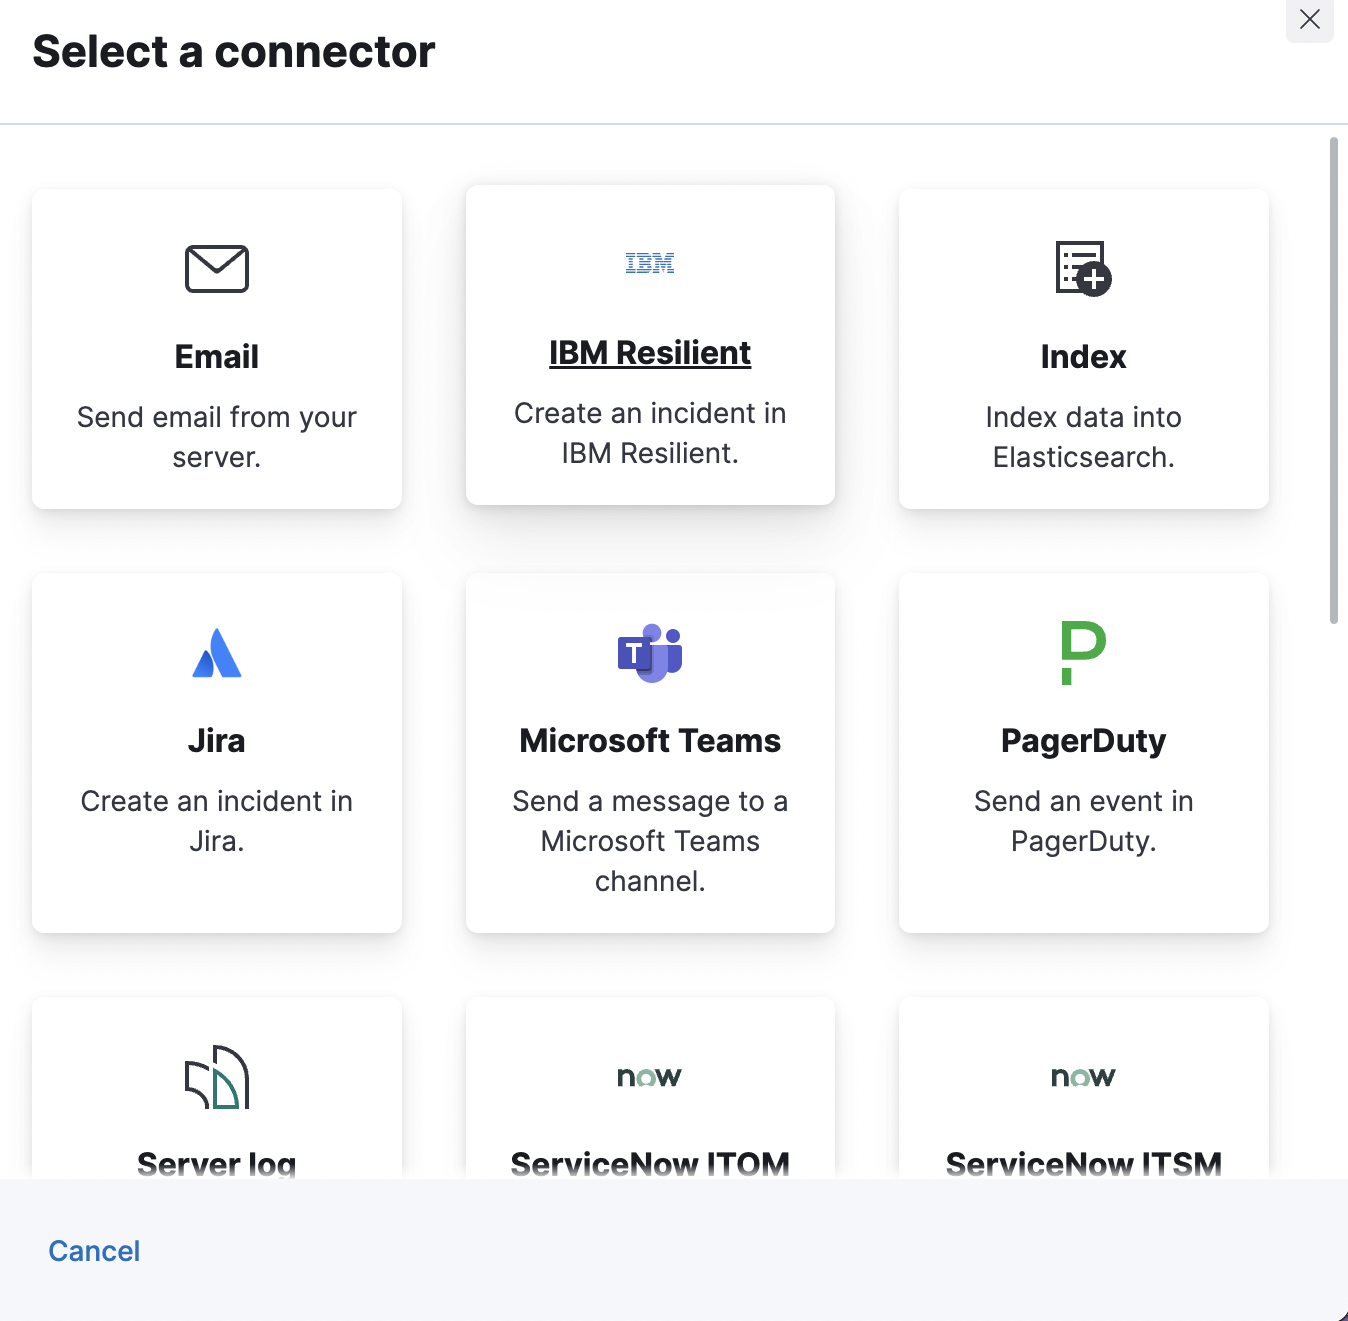
Creating a new connector
editNew connectors can be created with the Create connector button, which guides you to select the type of connector and configure its properties.
After you create a connector, it is available for use any time you set up an action in the current space.
For out-of-the-box and standardized connectors, refer to preconfigured connectors.
Importing and exporting connectors
editTo import and export connectors, use the Saved Objects Management UI.
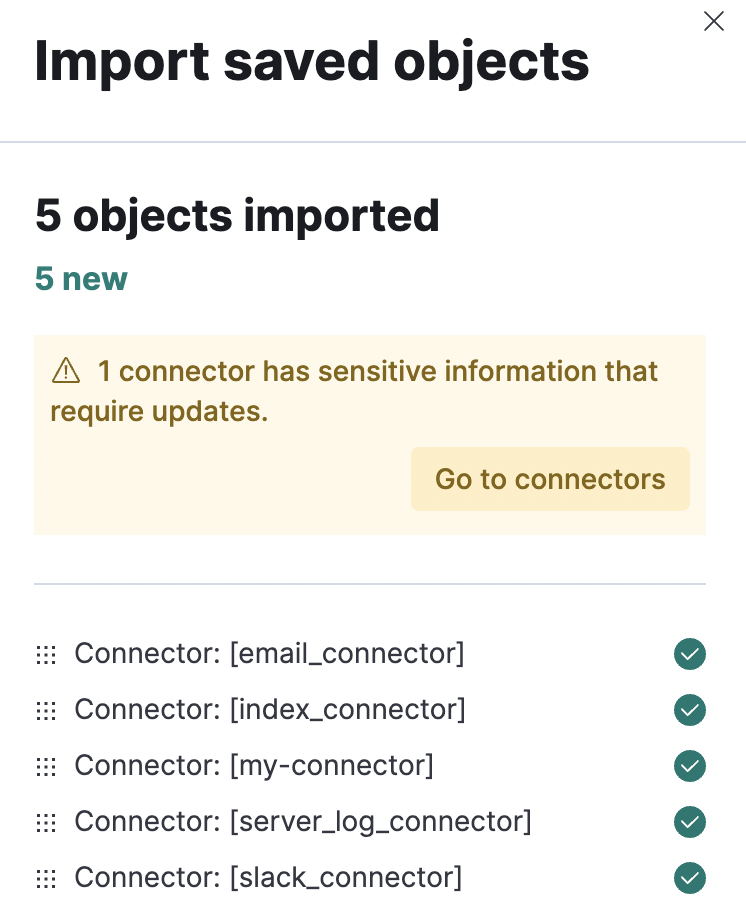
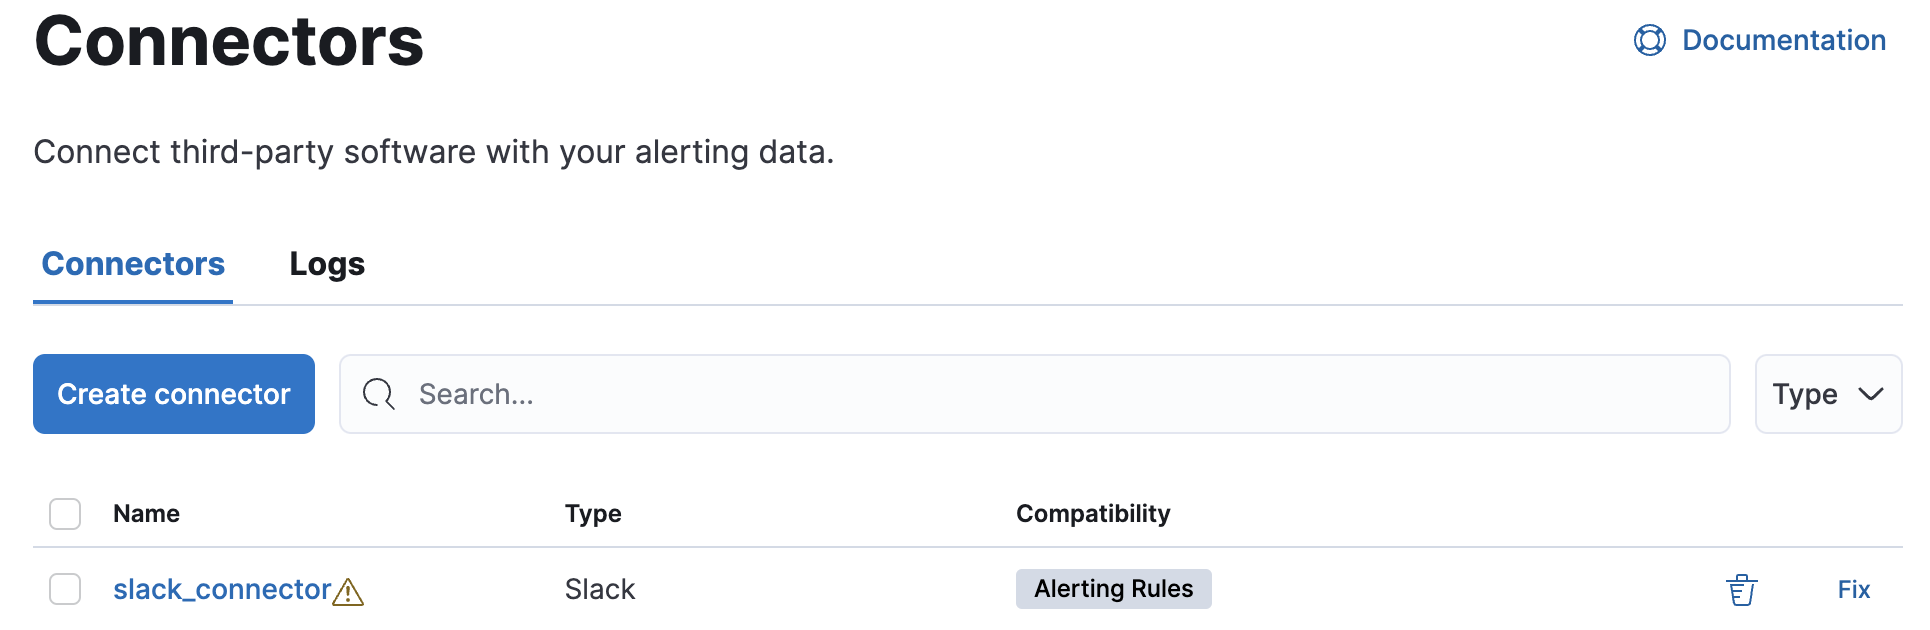
If a connector is missing sensitive information after the import, a Fix button appears in Connectors.
Monitoring connectors
editThe Task Manager health API helps you understand the performance of all tasks in your environment. However, if connectors fail to run, they will report as successful to Task Manager. The failure stats will not accurately depict the performance of connectors.
For more information on connector successes and failures, refer to the Event log index.