What’s new in 8.6
editWhat’s new in 8.6
editHere are the highlights of what’s new and improved in 8.6. For detailed information about this release, check the release notes.
Previous versions: 8.5 | 8.4 | 8.3 | 8.2 | 8.1 | 8.0
Flexible analysis with temporary data views
editCreate temporary data views on the fly, allowing you to explore and visualize your data before you’re ready to share your insights with others in your organization. Add fields and create an Elasticsearch query alert, just like you would a regular data view. When you’re ready, you can save the data view for a fully collaborative experience. For more information, check Create a data view.
Visualization editors
editTrend lines on metric visualizations
edit[preview] This functionality is in technical preview and may be changed or removed in a future release. Elastic will work to fix any issues, but features in technical preview are not subject to the support SLA of official GA features. Layering visual components helps you to create even more powerful visualizations for your dashboards. With the metric visualization in Lens, you can now add trend lines to highlight important trends in your data and uncover insights.
Partition charts with multiple metrics
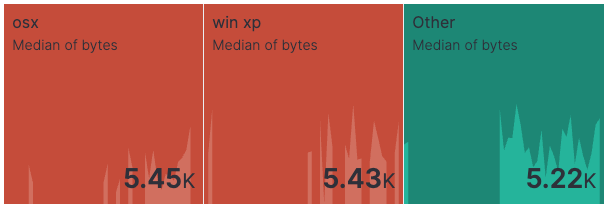
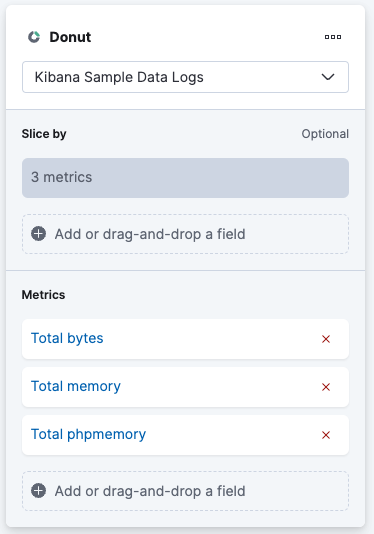
editMaking sense of your data just got a whole lot easier. In Lens, you can create partition charts with multiple metrics, which is helpful for when you want a complete view of your data, such as the rate of errors by type under different conditions.
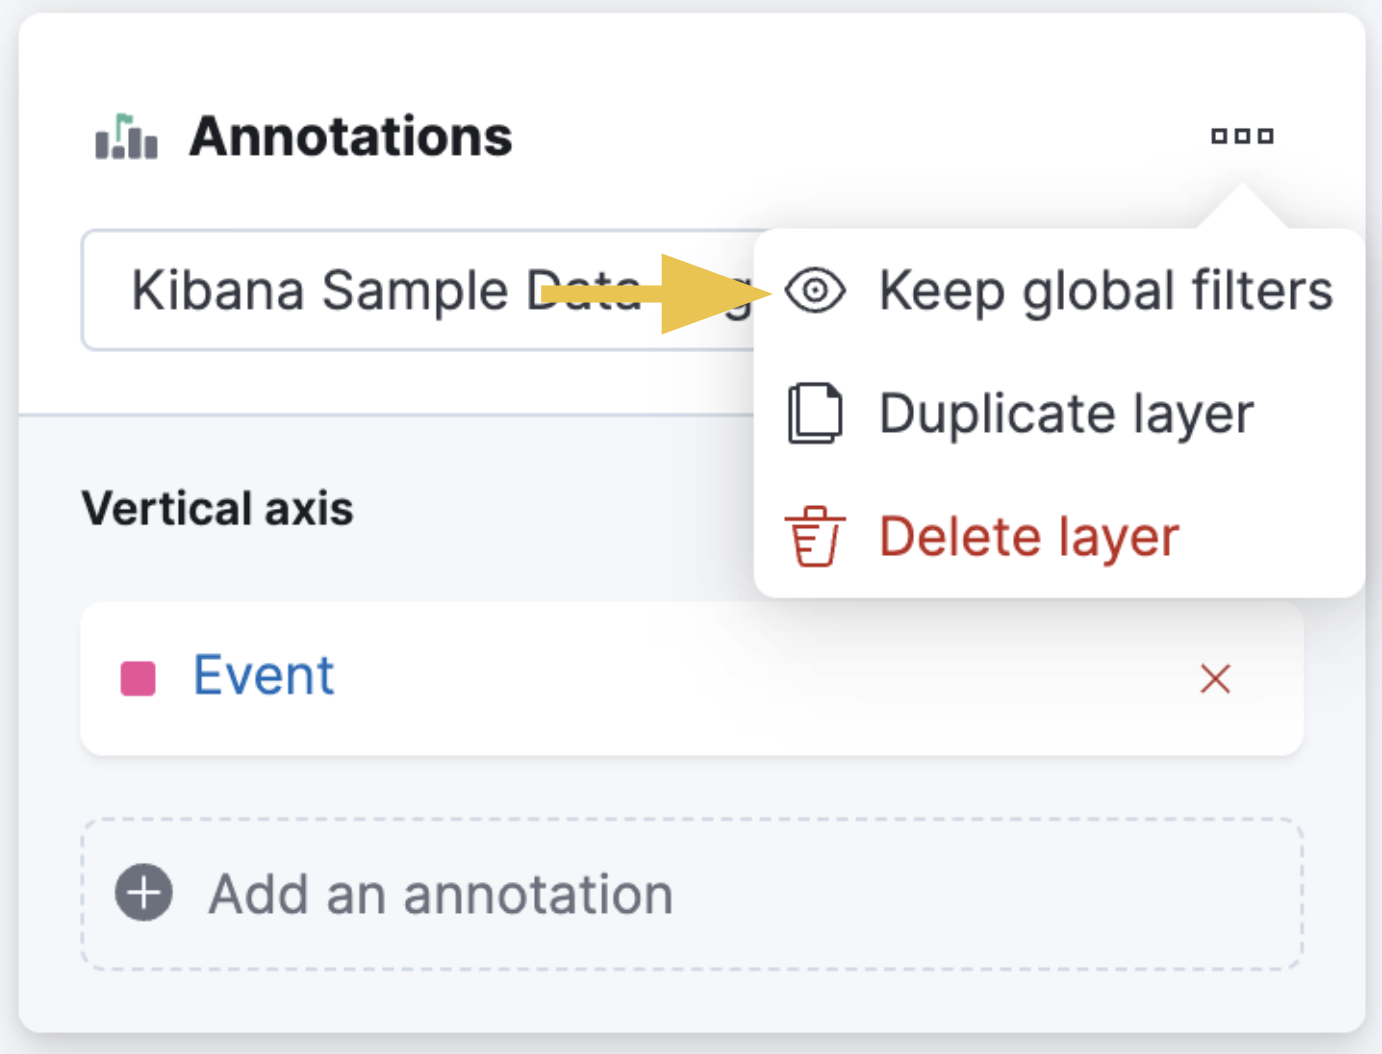
Global filters for annotations
editIn Lens, use your configured global filters with annotations. Now, the annotations that call out significant changes and trends in your time-based visualizations, incorporate all of your filters. For more information about Lens annotations, check Add annotations.
Maps
editLayer groups
editReduce legend clutter by organizing map layers into groups. Show or hide all layers in a group with a single click.
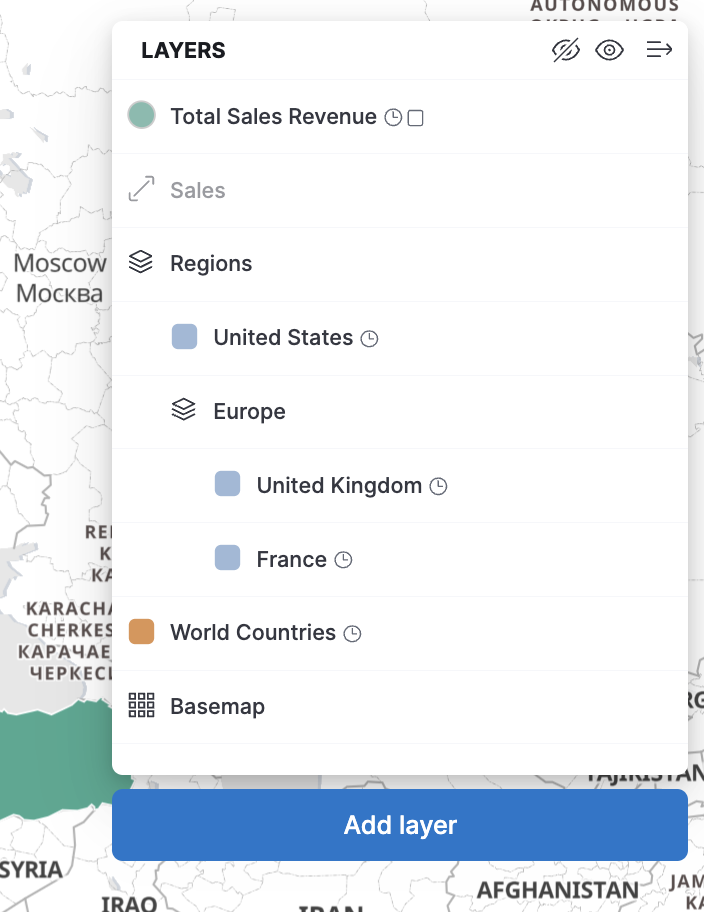
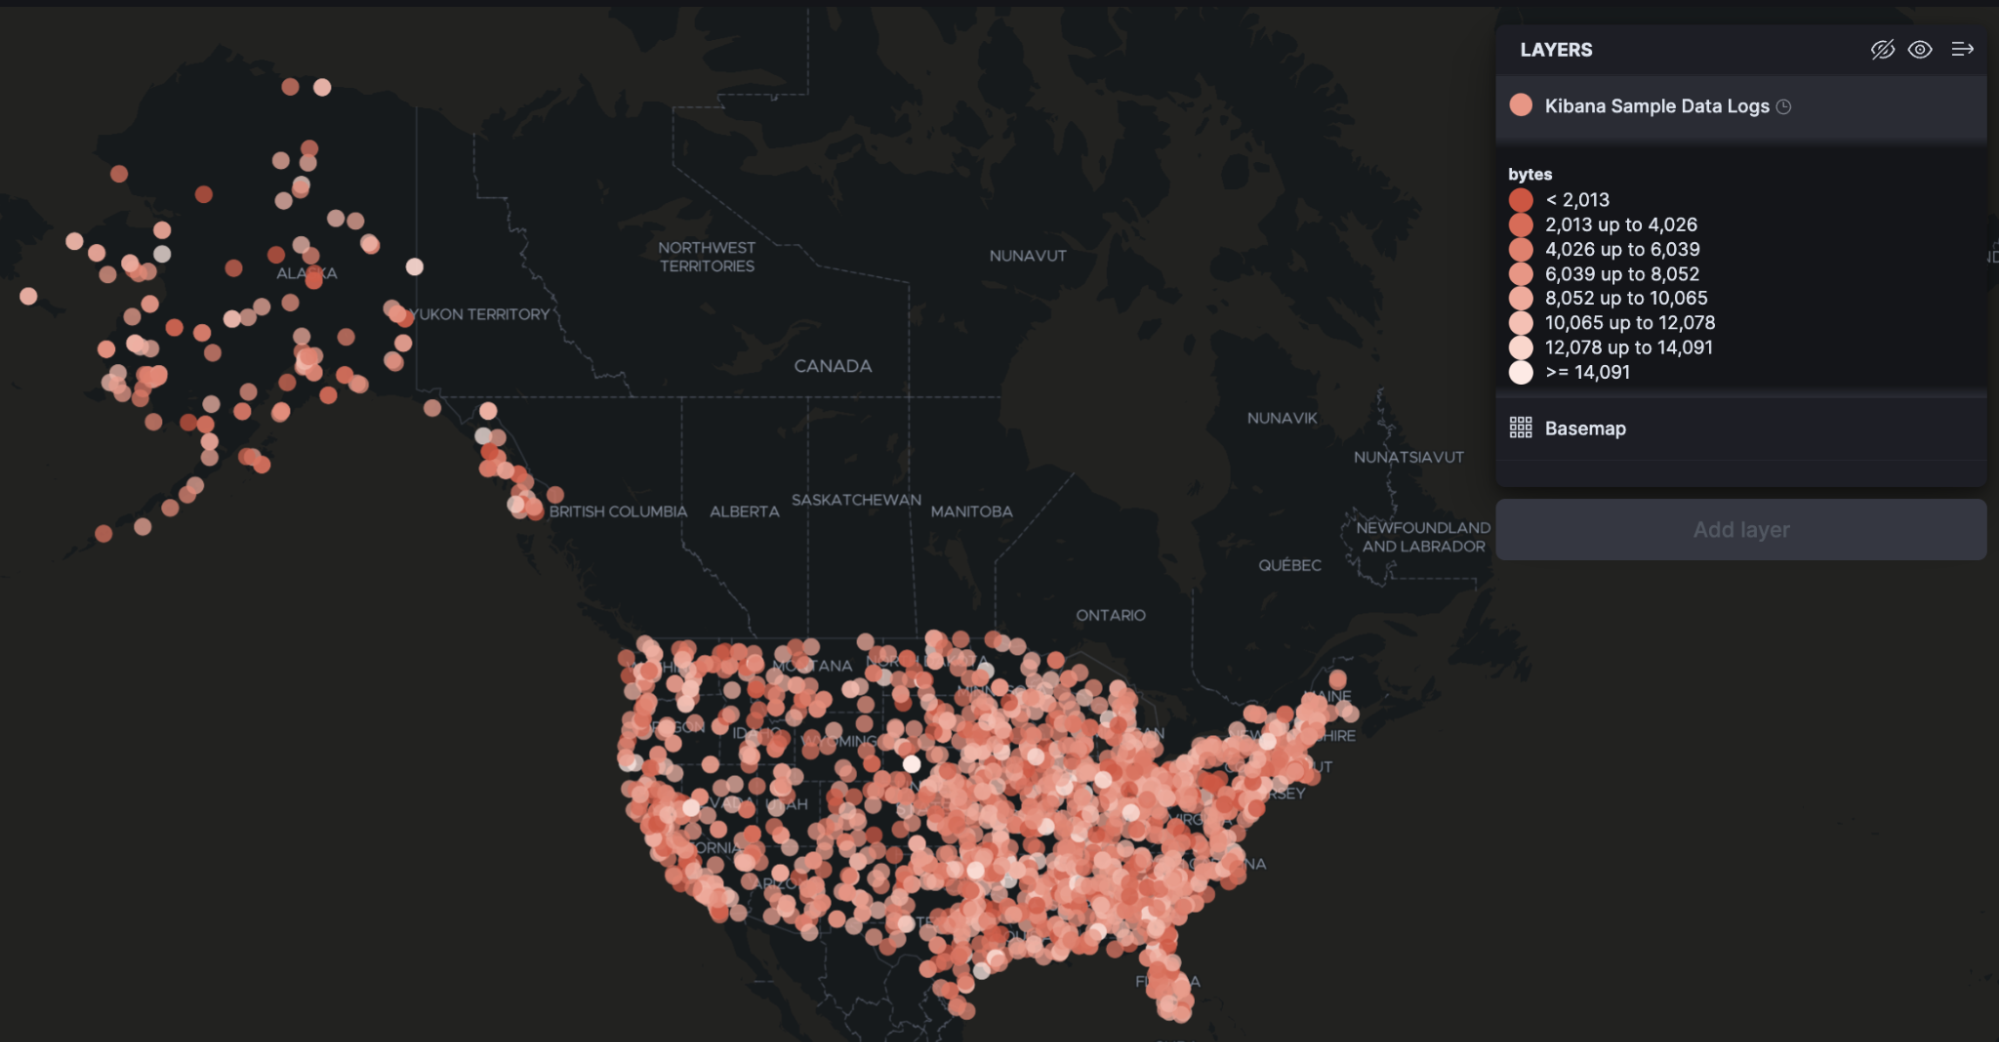
Color ramp and symbol size inversion
editInvert color ramps and symbol size to symbolize smaller values with more intense colors.
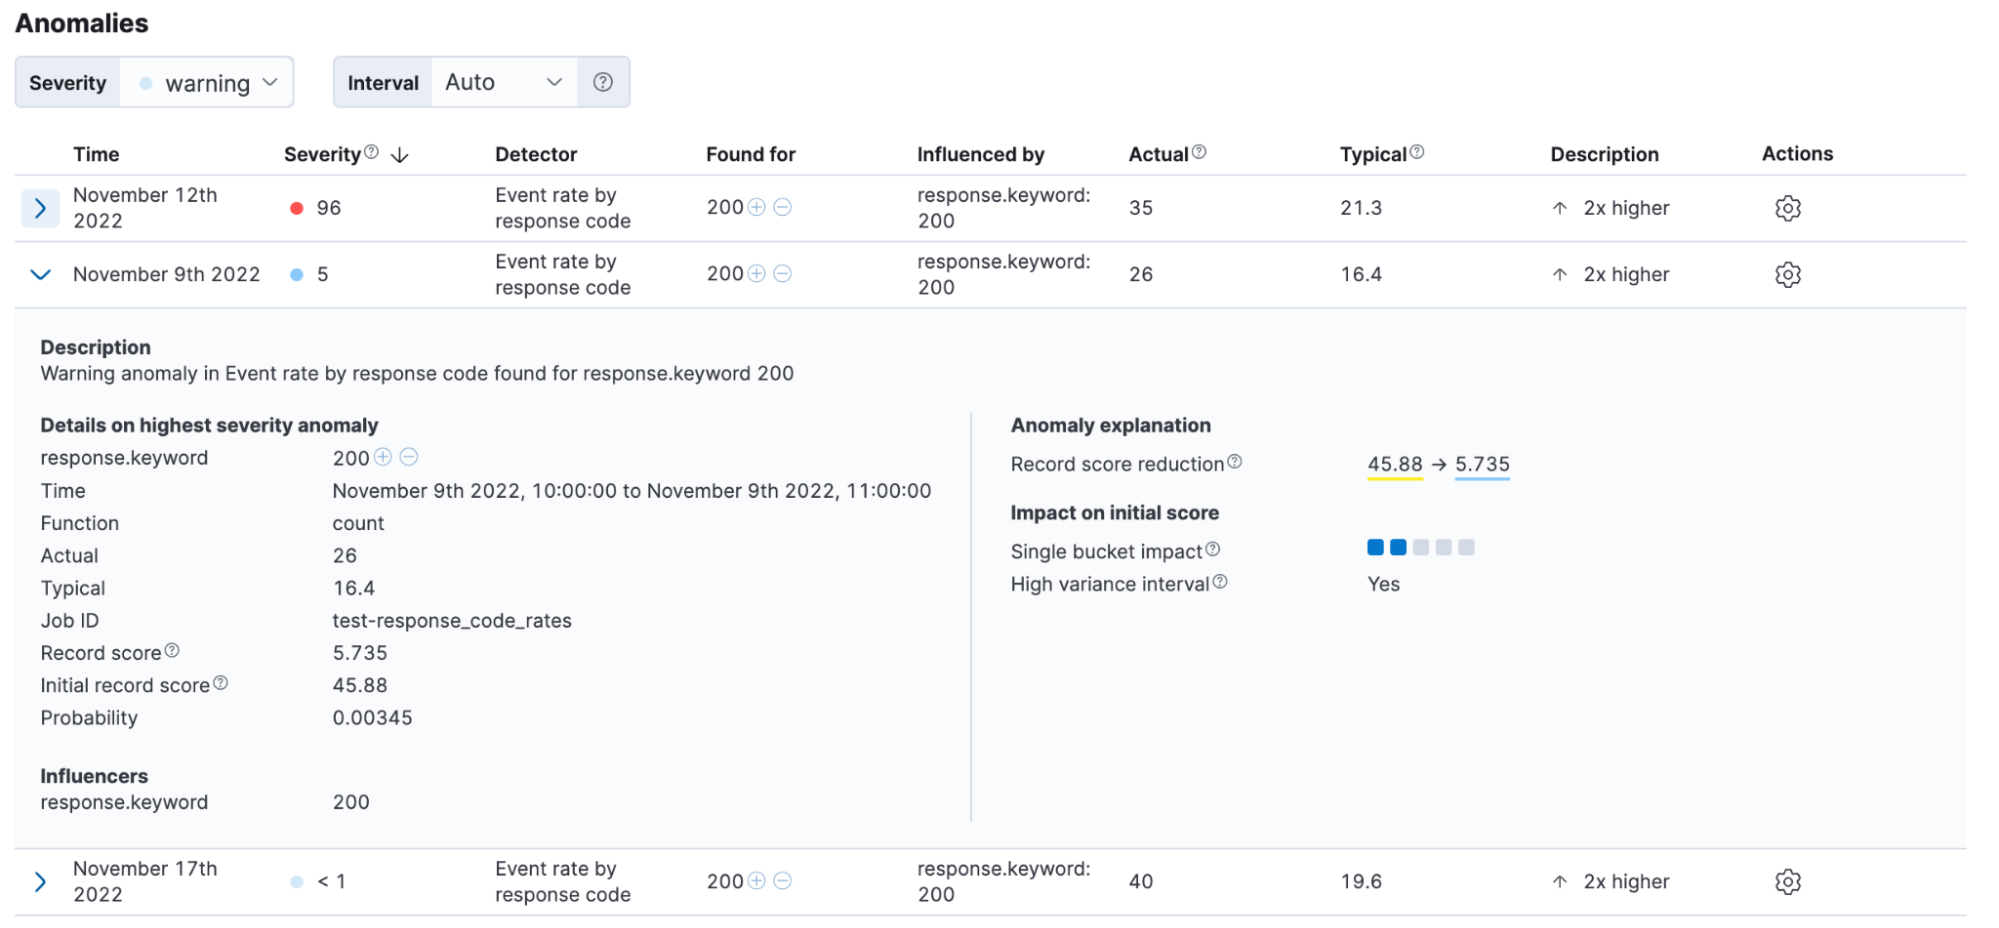
More anomaly info in Machine Learning
editAdditional information is now available on the anomaly table to help explain why something is anomalous and to show that the anomaly score has significantly changed from its initial value. Each explanatory item has tooltips that help users better understand the anomaly.
Read-only views in Security
editKibana now has read-only versions of the Users and Roles management views.
These views are for
users with the newly introduced read_security cluster privilege in Elasticsearch.
Cases
editThese features are all available for cases in Stack Management, Observability, and the Elastic Security app.
Email notifications for case assignments
editEnhancing the case assignment capability, this release adds email notifications when a user is assigned a case. Email notifications include the case title, status, severity, tags, and a link to the case in Kibana. For more information, check Add email notifications.
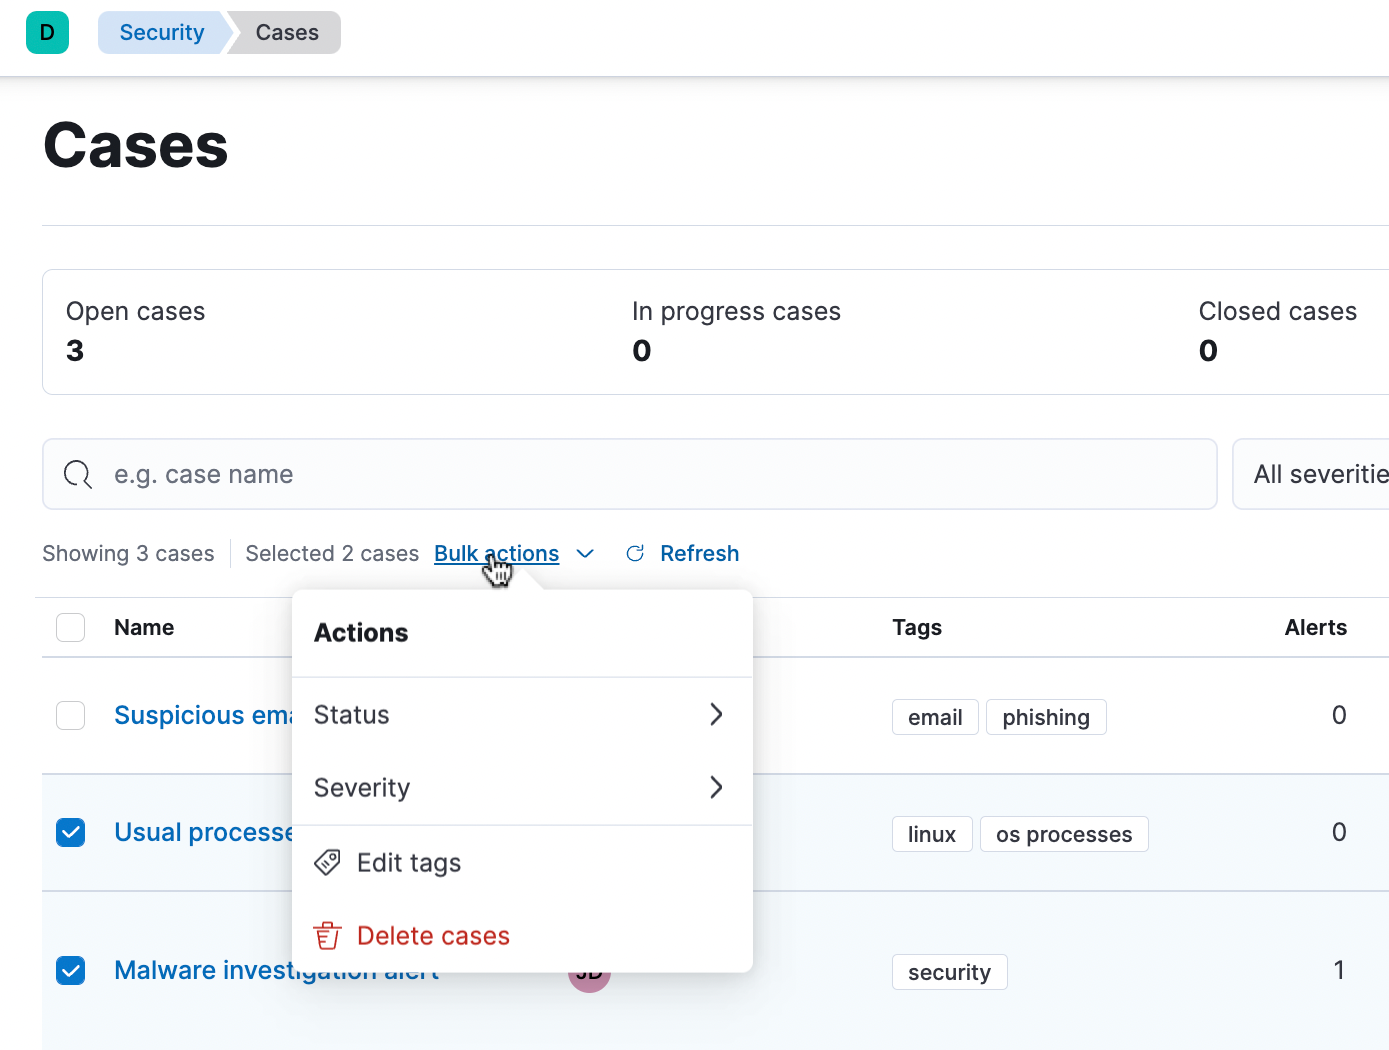
Update multiple cases with bulk actions
editNew actions are now supported in order to streamline case management: delete cases or change their status, tags, or severity.
Opsgenie connector
editCreate rules that trigger an action when an alert is detected and create an associated Opsgenie alert. The connector supports Opsgenie fields like message, description, priority, responder, alias, and details. For more information, check Opsgenie.