- Kibana Guide: other versions:
- What is Kibana?
- What’s new in 8.6
- Kibana concepts
- Quick start
- Set up
- Install Kibana
- Configure Kibana
- Alerting and action settings
- APM settings
- Banners settings
- Enterprise Search settings
- Fleet settings
- i18n settings
- Logging settings
- Logs settings
- Metrics settings
- Monitoring settings
- Reporting settings
- Search sessions settings
- Secure settings
- Security settings
- Spaces settings
- Task Manager settings
- Telemetry settings
- URL drilldown settings
- Start and stop Kibana
- Access Kibana
- Securing access to Kibana
- Add data
- Upgrade Kibana
- Configure security
- Configure reporting
- Configure logging
- Configure monitoring
- Command line tools
- Production considerations
- Discover
- Dashboard and visualizations
- Canvas
- Maps
- Build a map to compare metrics by country or region
- Track, visualize, and alert on assets in real time
- Map custom regions with reverse geocoding
- Heat map layer
- Tile layer
- Vector layer
- Plot big data
- Search geographic data
- Configure map settings
- Connect to Elastic Maps Service
- Import geospatial data
- Troubleshoot
- Reporting and sharing
- Machine learning
- Graph
- Alerting
- Observability
- APM
- Security
- Dev Tools
- Fleet
- Osquery
- Stack Monitoring
- Stack Management
- REST API
- Get features API
- Kibana spaces APIs
- Kibana role management APIs
- User session management APIs
- Saved objects APIs
- Data views API
- Index patterns APIs
- Alerting APIs
- Action and connector APIs
- Cases APIs
- Import and export dashboard APIs
- Logstash configuration management APIs
- Machine learning APIs
- Osquery manager API
- Short URLs APIs
- Get Task Manager health
- Upgrade assistant APIs
- Kibana plugins
- Troubleshooting
- Accessibility
- Release notes
- Developer guide
Preconfigured connectors
editPreconfigured connectors
editIf you are running Kibana on-prem, you can preconfigure a connector to have all
the information it needs prior to startup by adding it to the kibana.yml
file.
Elasticsearch Service provides a preconfigured email connector but you cannot create additional preconfigured connectors.
Preconfigured connectors offer the following benefits:
- Require no setup. Configuration and credentials needed to run an action are predefined, including the connector name and ID.
- Appear in all spaces because they are not saved objects.
- Cannot be edited or deleted.
Create preconfigured connectors
editAdd xpack.actions.preconfigured
settings to your kibana.yml
file. The
settings vary depending on which type of connector you’re adding.
This example shows a valid configuration for a Slack connector and a Webhook connector:
xpack.actions.preconfigured: my-slack1: actionTypeId: .slack name: 'Slack #xyz' secrets: webhookUrl: 'https://hooks.slack.com/services/abcd/efgh/ijklmnopqrstuvwxyz' webhook-service: actionTypeId: .webhook name: 'Email service' config: url: 'https://email-alert-service.elastic.co' method: post headers: header1: value1 header2: value2 secrets: user: elastic password: changeme
The key is the connector identifier, |
|
|
|
|
|
|
|
|
Sensitive properties, such as passwords, can also be stored in the Kibana keystore.
Built-in preconfigured connectors
editKibana provides the following built-in preconfigured connectors:
View preconfigured connectors
editWhen you open the main menu, click Stack Management > Connectors. Preconfigured connectors appear regardless of which space you are in. They are tagged as “preconfigured”, and you cannot delete them.
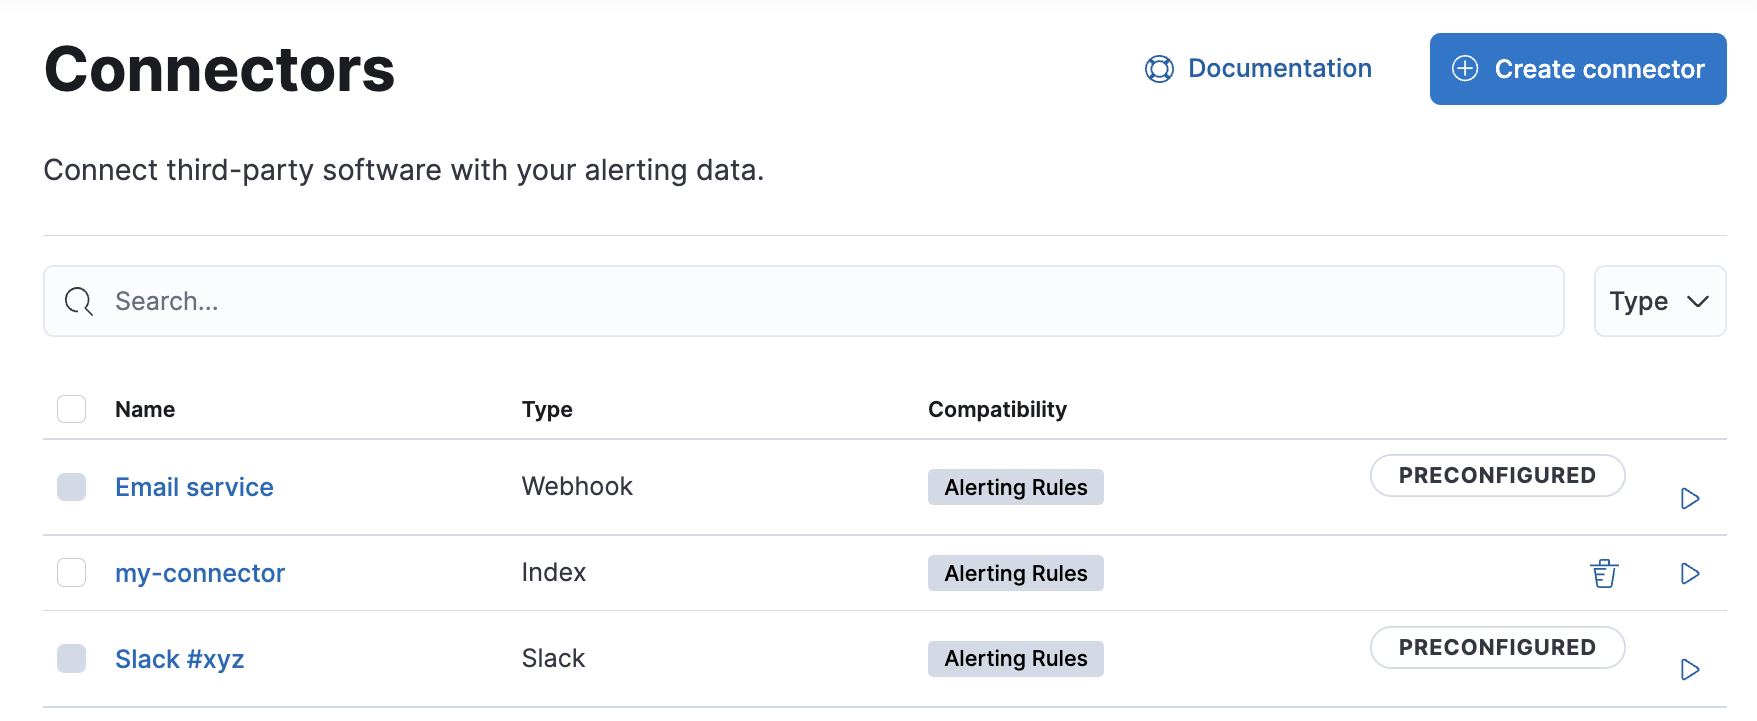
Clicking a preconfigured connector shows the description, but not the configuration.
On this page