- Kibana Guide: other versions:
- What is Kibana?
- What’s new in 8.4
- Kibana concepts
- Quick start
- Set up
- Install Kibana
- Configure Kibana
- Alerting and action settings
- APM settings
- Banners settings
- Enterprise Search settings
- Fleet settings
- i18n settings
- Logging settings
- Logs settings
- Metrics settings
- Monitoring settings
- Reporting settings
- Search sessions settings
- Secure settings
- Security settings
- Spaces settings
- Task Manager settings
- Telemetry settings
- URL drilldown settings
- Start and stop Kibana
- Access Kibana
- Securing access to Kibana
- Add data
- Upgrade Kibana
- Configure security
- Configure reporting
- Configure logging
- Configure monitoring
- Command line tools
- Production considerations
- Discover
- Dashboard and visualizations
- Canvas
- Maps
- Build a map to compare metrics by country or region
- Track, visualize, and alert on assets in real time
- Map custom regions with reverse geocoding
- Heat map layer
- Tile layer
- Vector layer
- Plot big data
- Search geographic data
- Configure map settings
- Connect to Elastic Maps Service
- Import geospatial data
- Troubleshoot
- Reporting and sharing
- Machine learning
- Graph
- Alerting
- Observability
- APM
- Security
- Dev Tools
- Fleet
- Osquery
- Stack Monitoring
- Stack Management
- REST API
- Get features API
- Kibana spaces APIs
- Kibana role management APIs
- User session management APIs
- Saved objects APIs
- Data views API
- Index patterns APIs
- Alerting APIs
- Action and connector APIs
- Cases APIs
- Import and export dashboard APIs
- Logstash configuration management APIs
- Machine learning APIs
- Osquery manager API
- Short URLs APIs
- Get Task Manager health
- Upgrade assistant APIs
- Kibana plugins
- Troubleshooting
- Accessibility
- Release notes
- Developer guide
Dependencies
editDependencies
editAPM agents collect details about external calls made from instrumented services. Sometimes, these external calls resolve into a downstream service that’s instrumented — in these cases, you can utilize distributed tracing to drill down into problematic downstream services. Other times, though, it’s not possible to instrument a downstream dependency — like with a database or third-party service. Dependencies gives you a window into these uninstrumented, downstream dependencies.
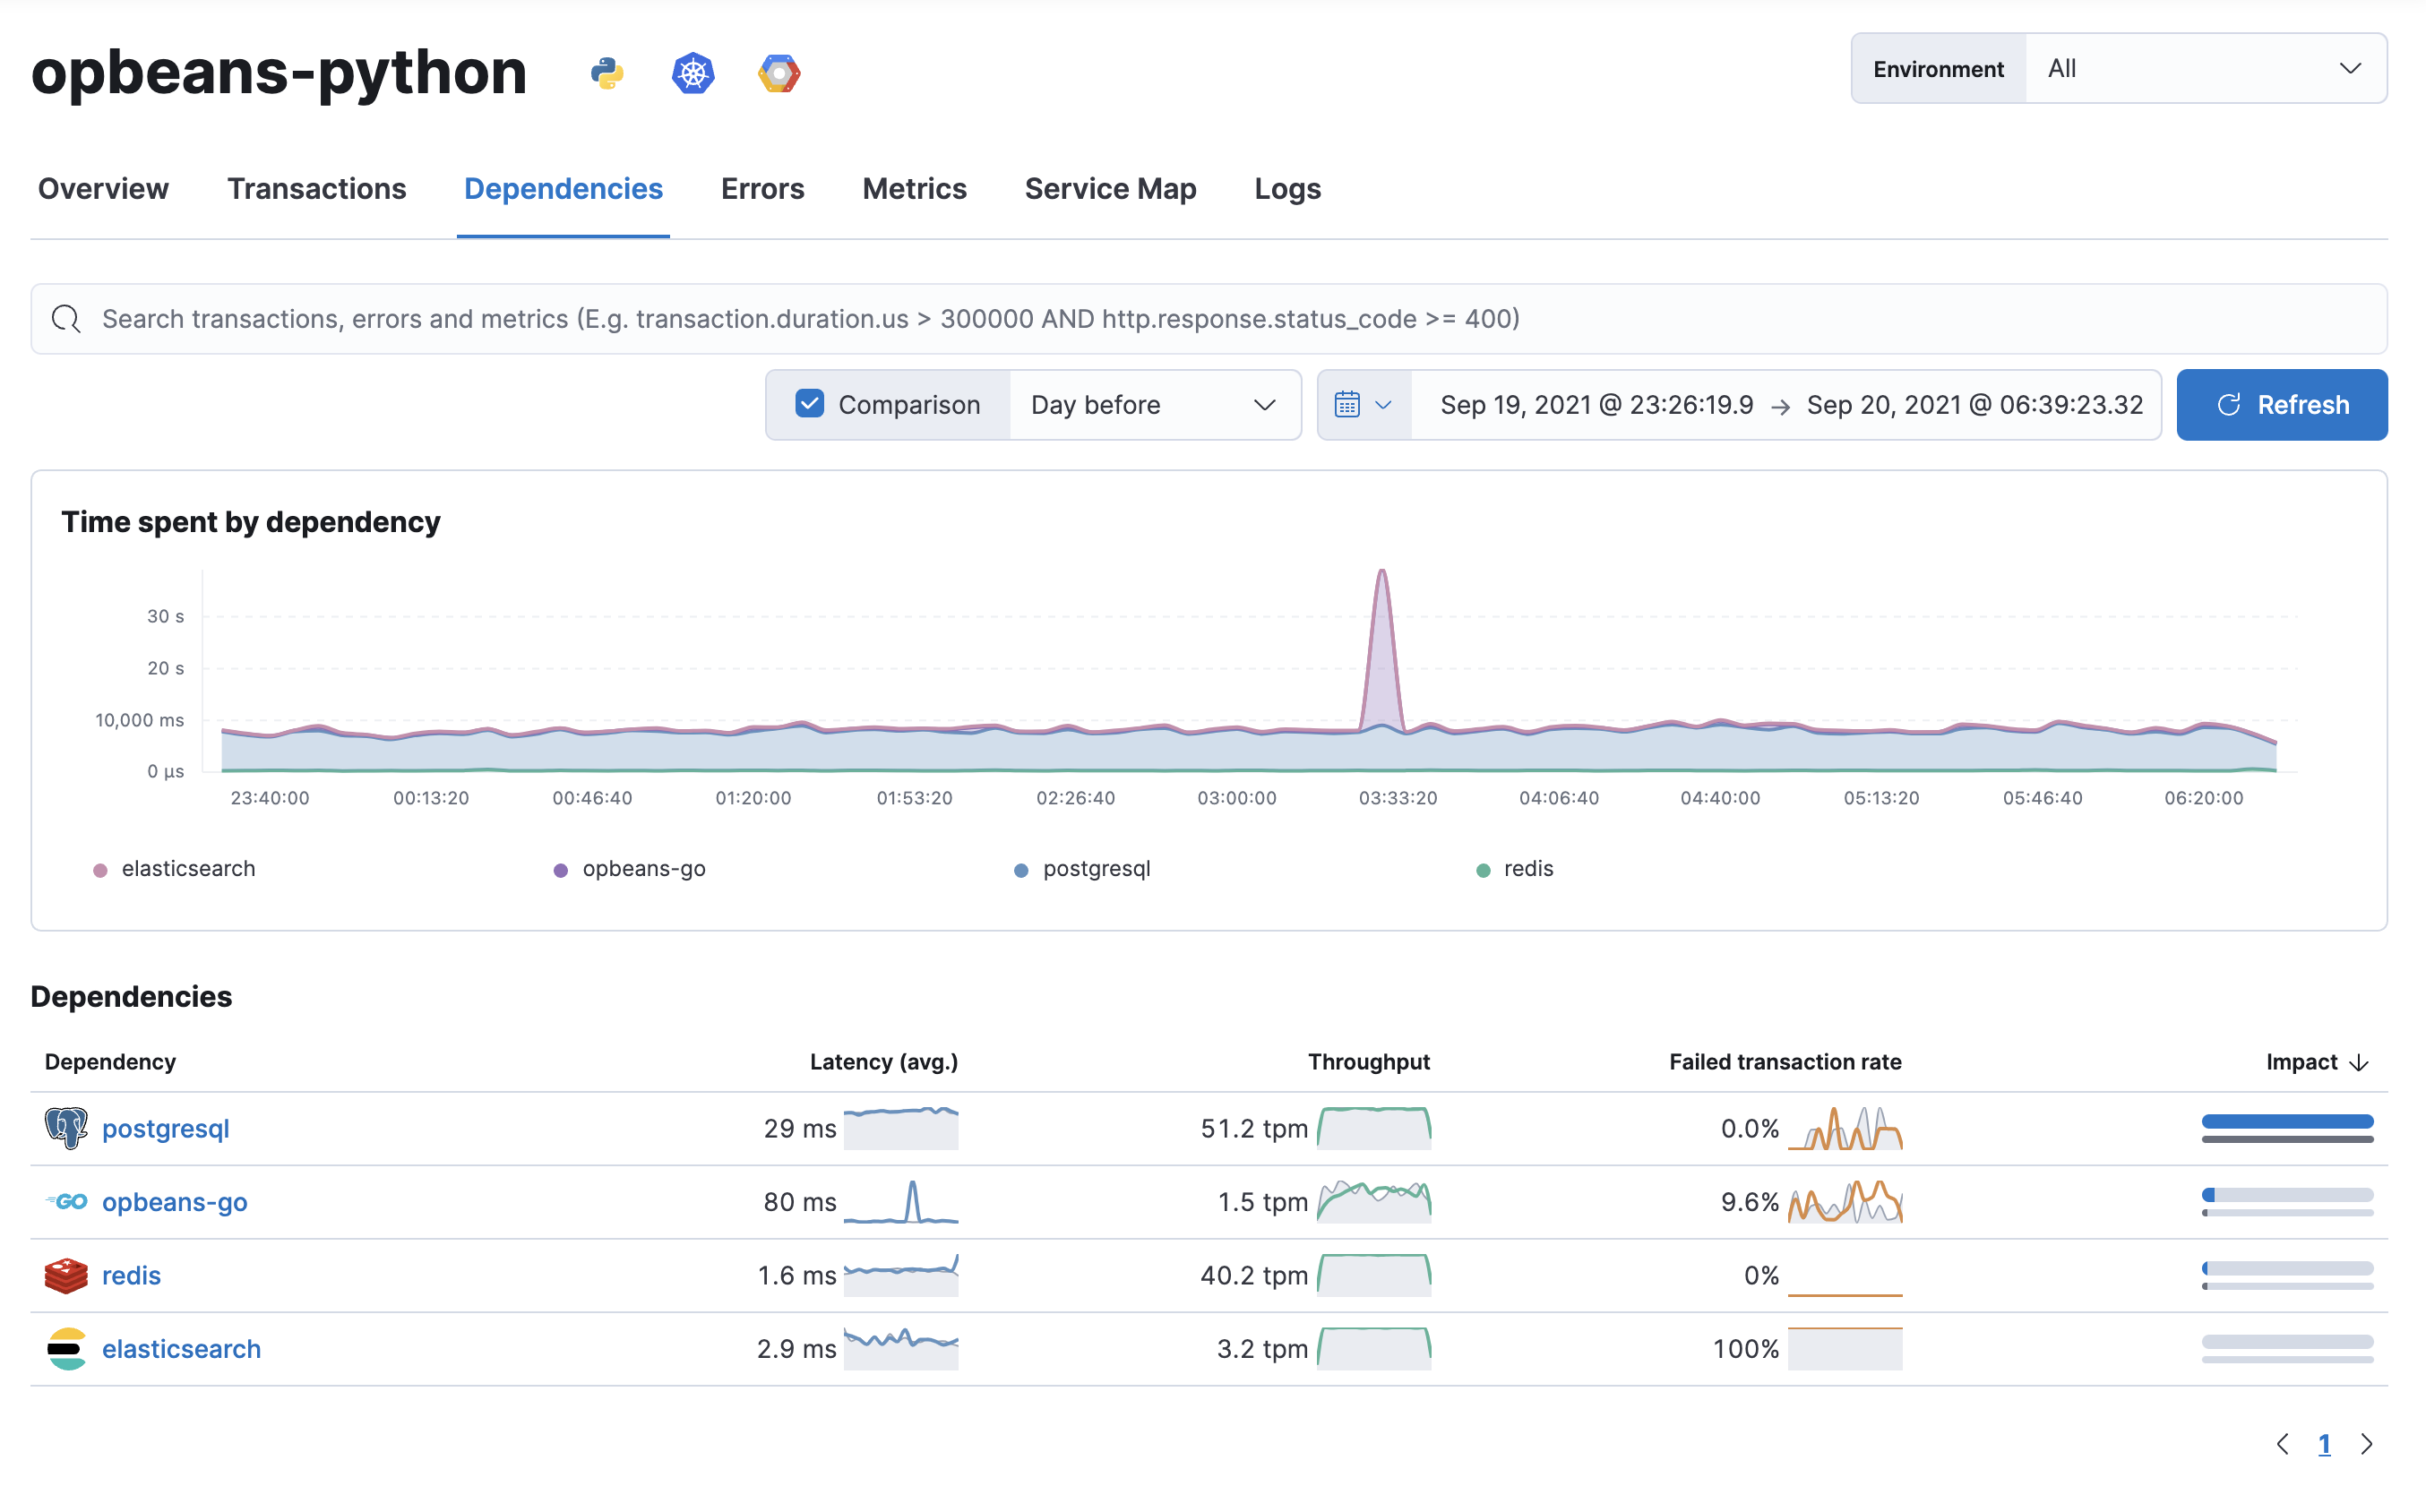
Many application issues are caused by slow or unresponsive downstream dependencies. And because a single, slow dependency can significantly impact the end-user experience, it’s important to be able to quickly identify these problems and determine the root cause.
Select a dependency to see detailed latency, throughput, and failed transaction rate metrics.
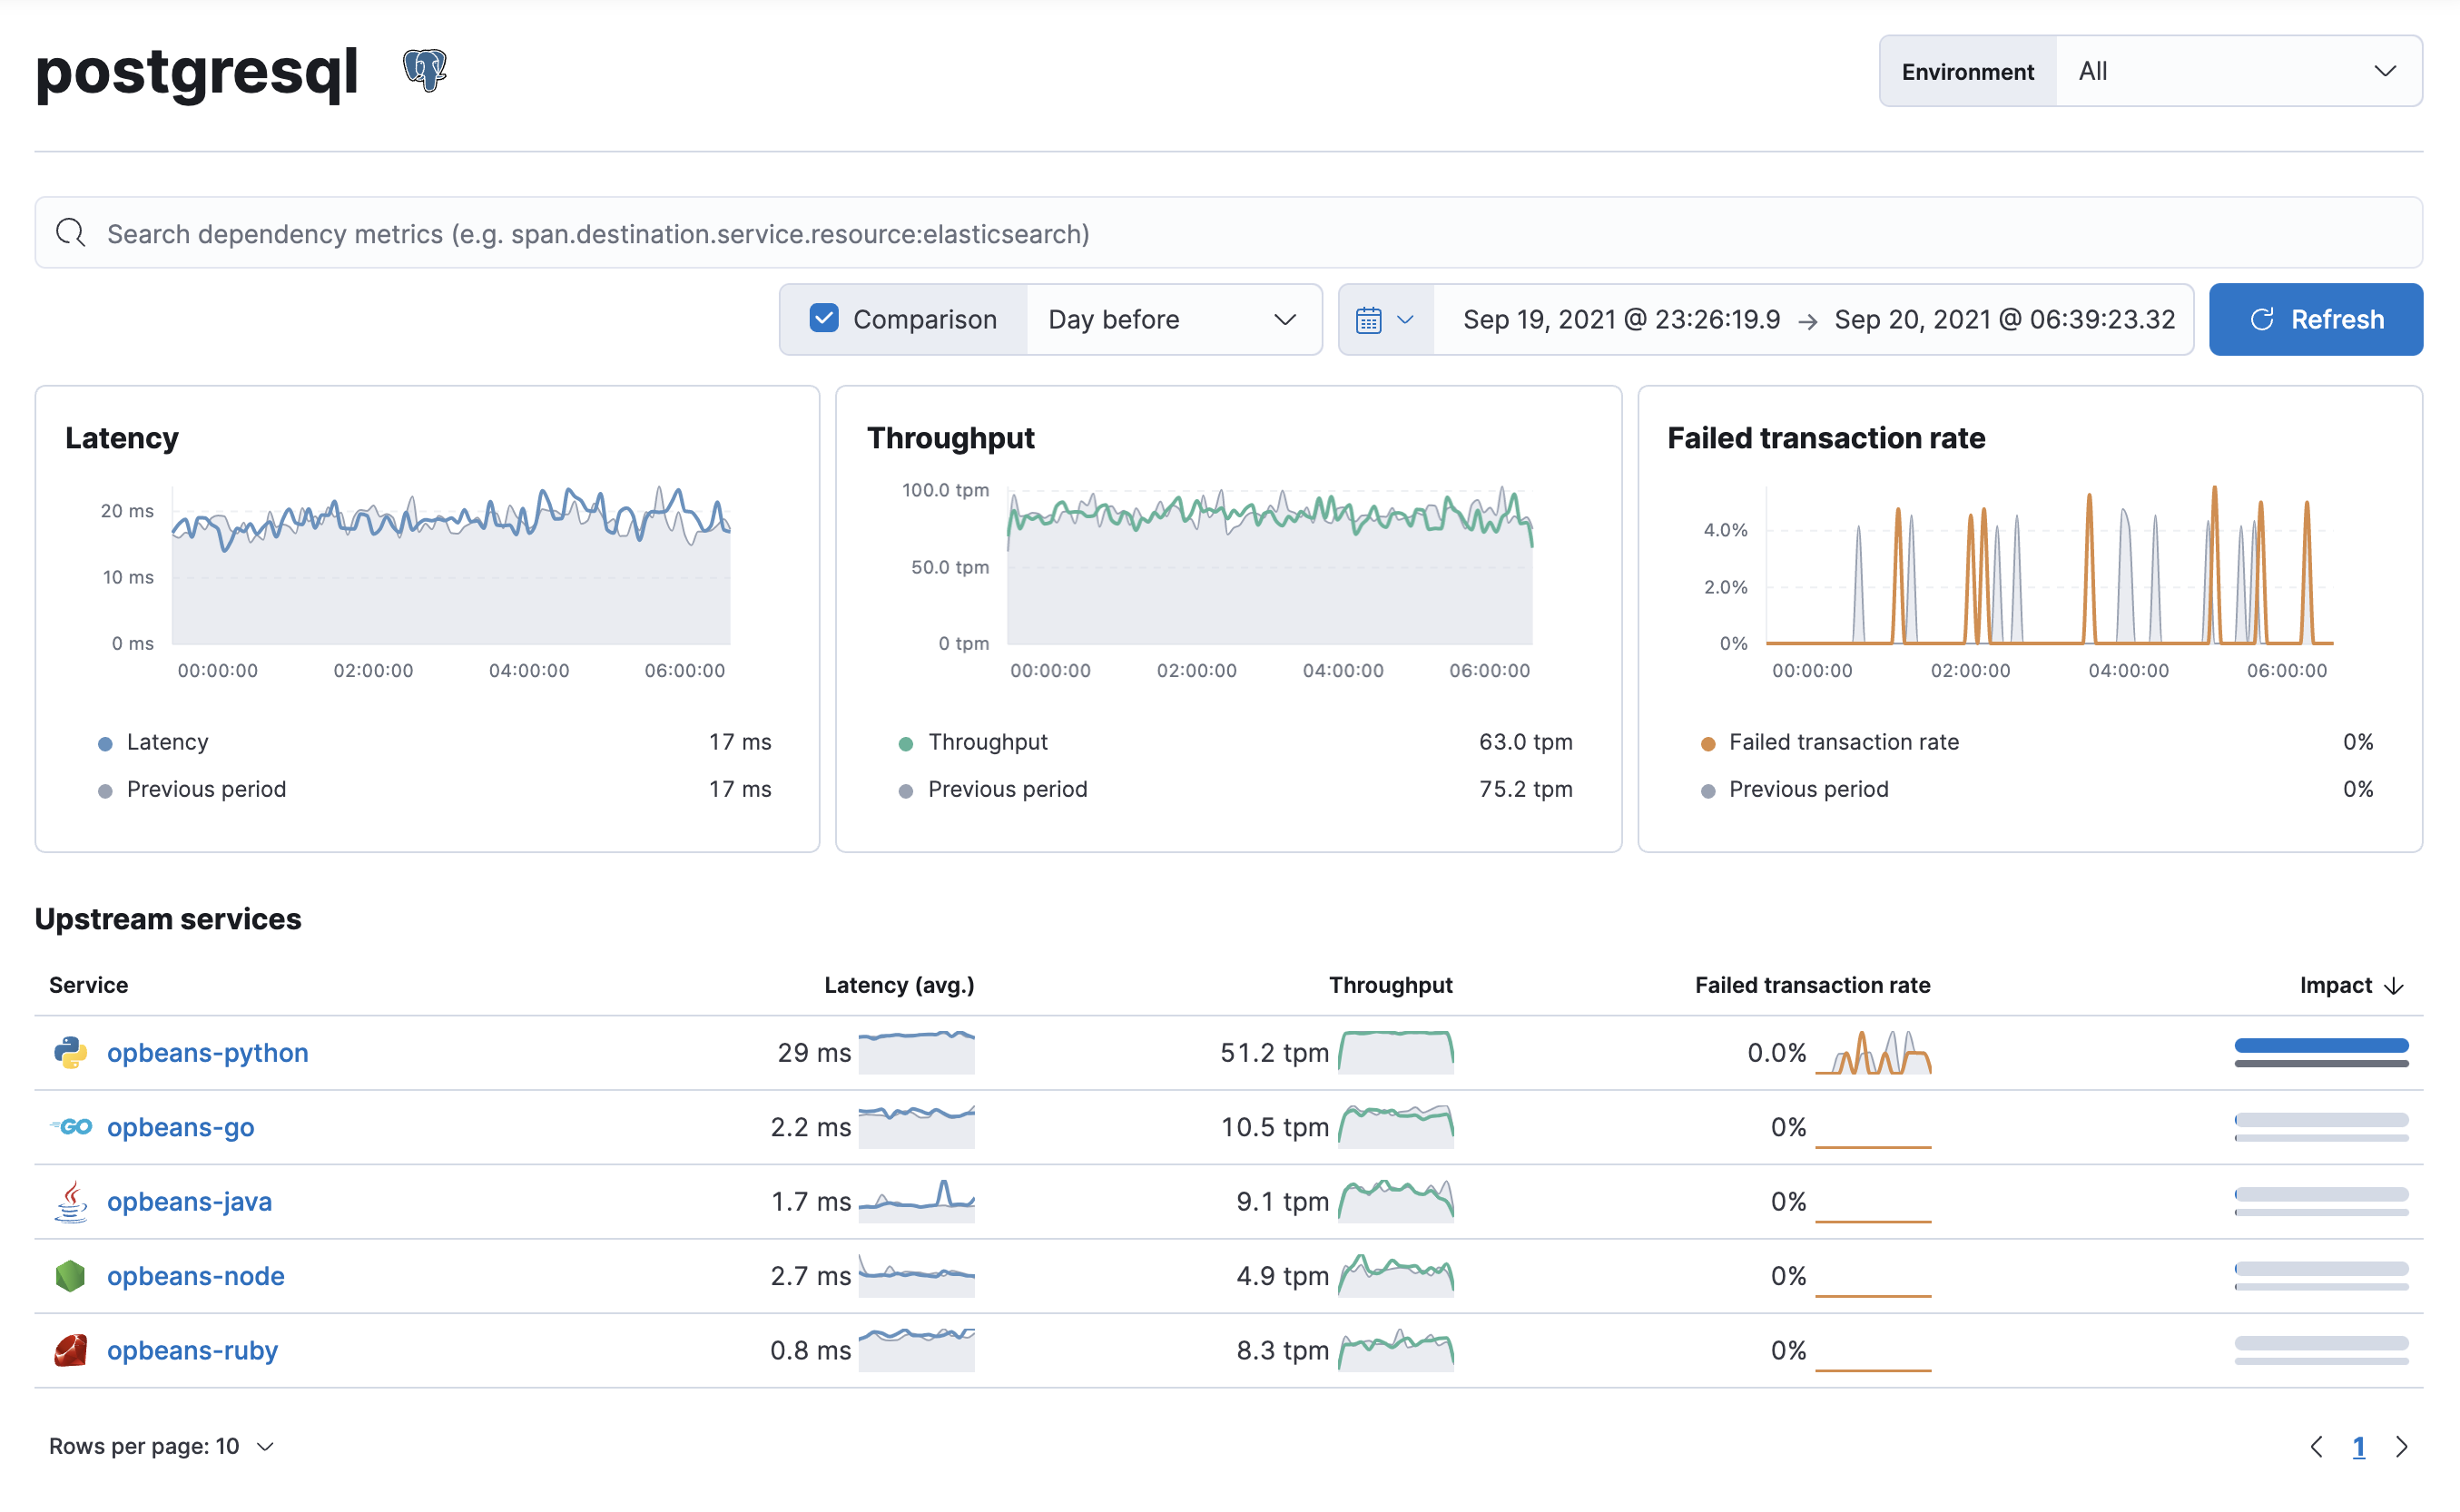
When viewing a dependency, consider your pattern of usage with that dependency. If your usage pattern hasn’t increased or decreased, but the experience has been negatively effected — either with an increase in latency or errors, there’s likely a problem with the dependency that needs to be addressed.
If your usage pattern has changed, the dependency view can quickly show you whether that pattern change exists in all upstream services, or just a subset of your services. You might then start digging into traces coming from impacted services to determine why that pattern change has occurred.