- Kibana Guide: other versions:
- What is Kibana?
- What’s new in 8.2
- Kibana concepts
- Quick start
- Set up
- Install Kibana
- Configure Kibana
- Alerting and action settings
- APM settings
- Banners settings
- Enterprise Search settings
- Fleet settings
- i18n settings
- Logging settings
- Logs settings
- Metrics settings
- Monitoring settings
- Reporting settings
- Search sessions settings
- Secure settings
- Security settings
- Spaces settings
- Task Manager settings
- Telemetry settings
- URL drilldown settings
- Start and stop Kibana
- Access Kibana
- Securing access to Kibana
- Add data
- Upgrade Kibana
- Configure security
- Configure reporting
- Configure logging
- Configure monitoring
- Command line tools
- Production considerations
- Discover
- Dashboard and visualizations
- Canvas
- Maps
- Build a map to compare metrics by country or region
- Track, visualize, and alert on assets in real time
- Map custom regions with reverse geocoding
- Heat map layer
- Tile layer
- Vector layer
- Plot big data
- Search geographic data
- Configure map settings
- Connect to Elastic Maps Service
- Import geospatial data
- Troubleshoot
- Reporting and sharing
- Machine learning
- Graph
- Alerting
- Observability
- APM
- Security
- Dev Tools
- Fleet
- Osquery
- Stack Monitoring
- Stack Management
- REST API
- Get features API
- Kibana spaces APIs
- Kibana role management APIs
- User session management APIs
- Saved objects APIs
- Data views API
- Index patterns APIs
- Alerting APIs
- Action and connector APIs
- Cases APIs
- Import and export dashboard APIs
- Logstash configuration management APIs
- Machine learning APIs
- Short URLs APIs
- Get Task Manager health
- Upgrade assistant APIs
- Kibana plugins
- Troubleshooting
- Accessibility
- Release notes
- Developer guide
View field statistics
editView field statistics
editThis functionality is in beta and is subject to change. The design and code is less mature than official GA features and is being provided as-is with no warranties. Beta features are not subject to the support SLA of official GA features.
Explore the fields in your data with the Field statistics view in Discover and answer such questions as:
- What does the latency look like when one of the containers is down on a Sunday?
- Is the field type and format in the data view appropriate for the data and its cardinality?
This example explores the fields in the sample web logs data, or you can use your own data.
- Open the main menu, and click Discover.
- Expand the data view dropdown, and select kibana_sample_data_logs.
- If you don’t see any results, expand the time range, for example, to Last 7 days.
-
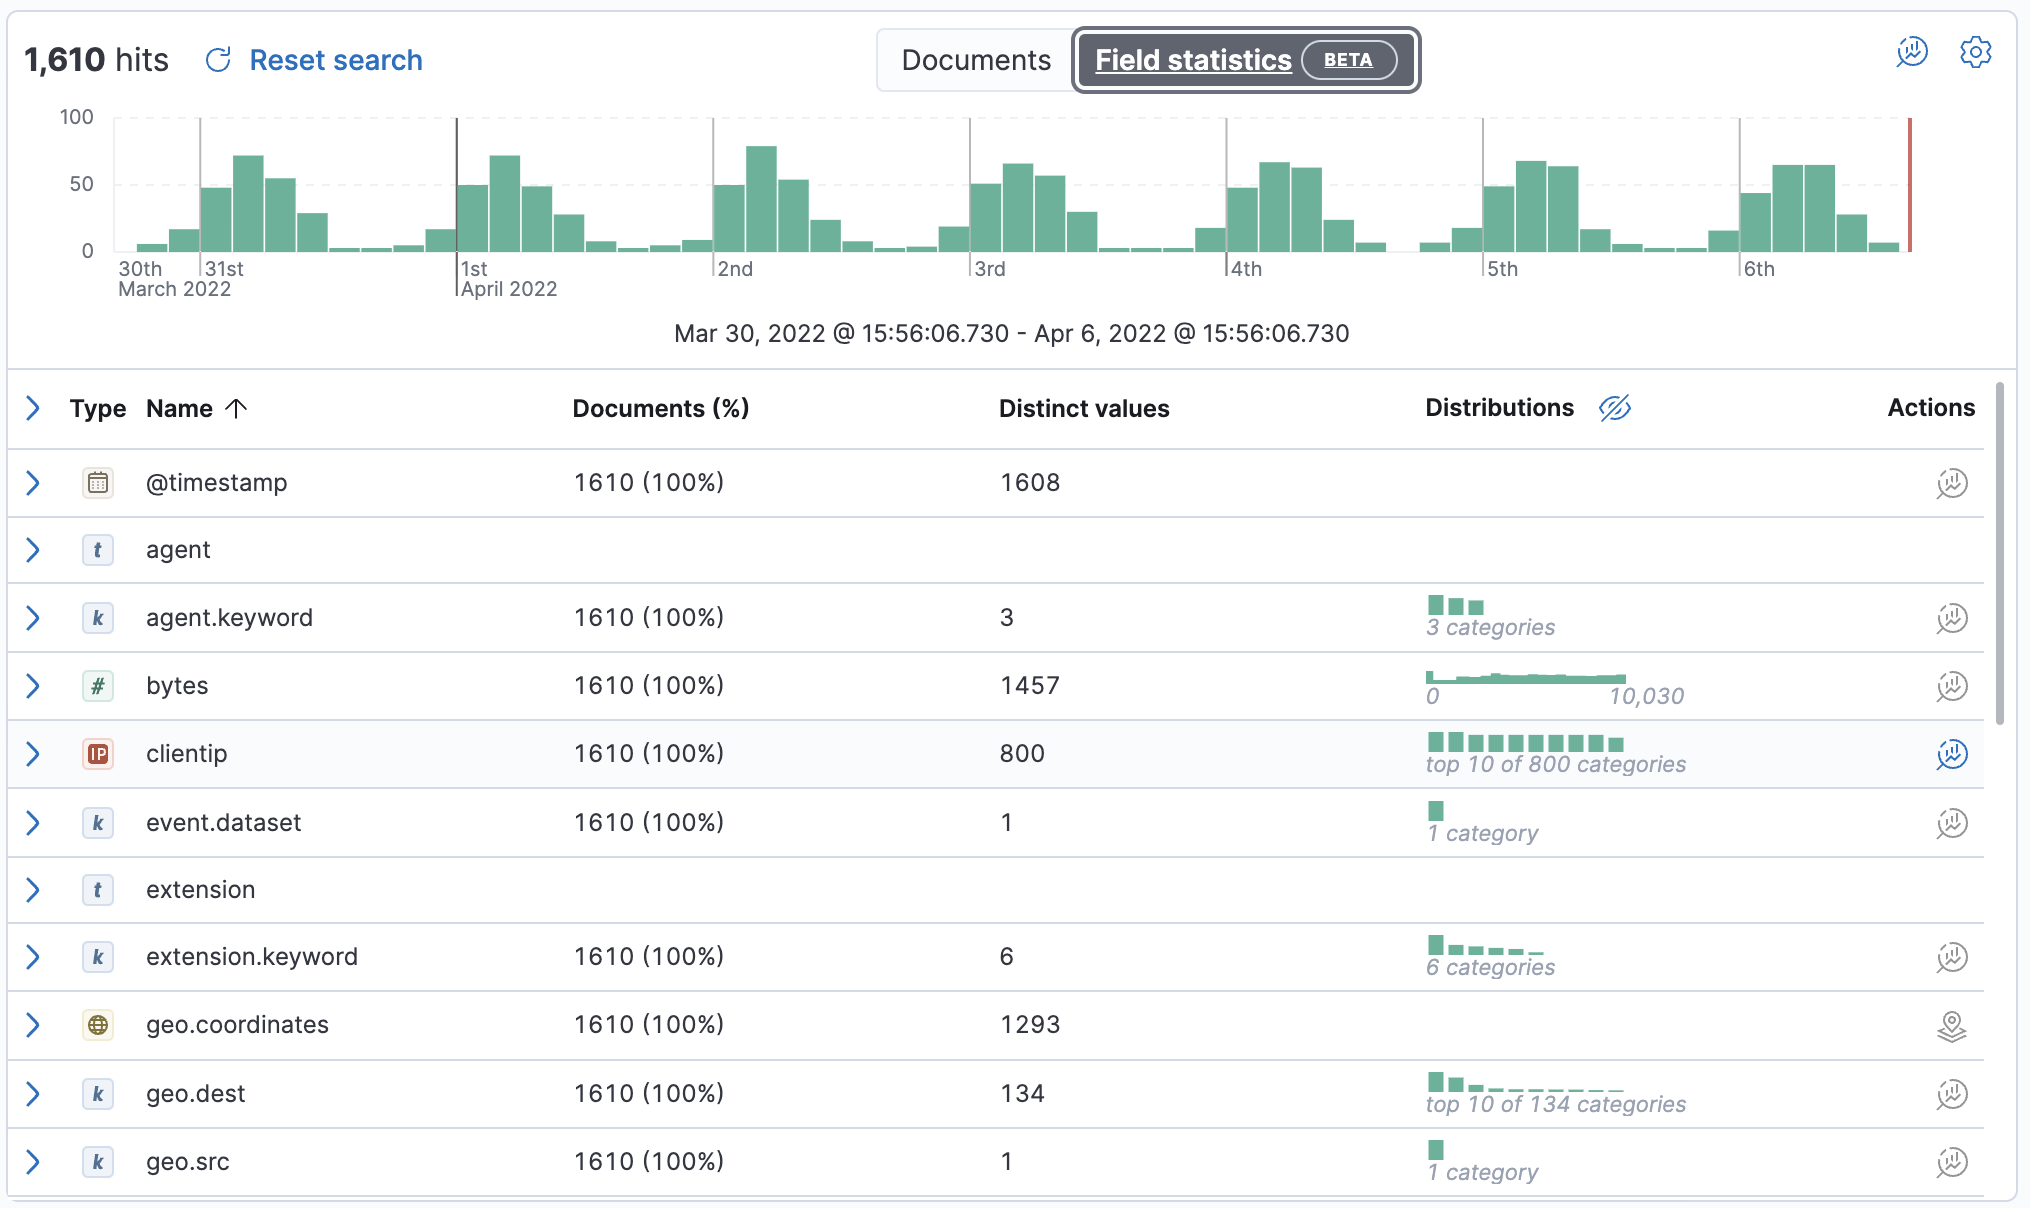
Click Field statistics.
The table summarizes how many documents in the sample contain each field for the selected time period the number of distinct values, and the distribution.
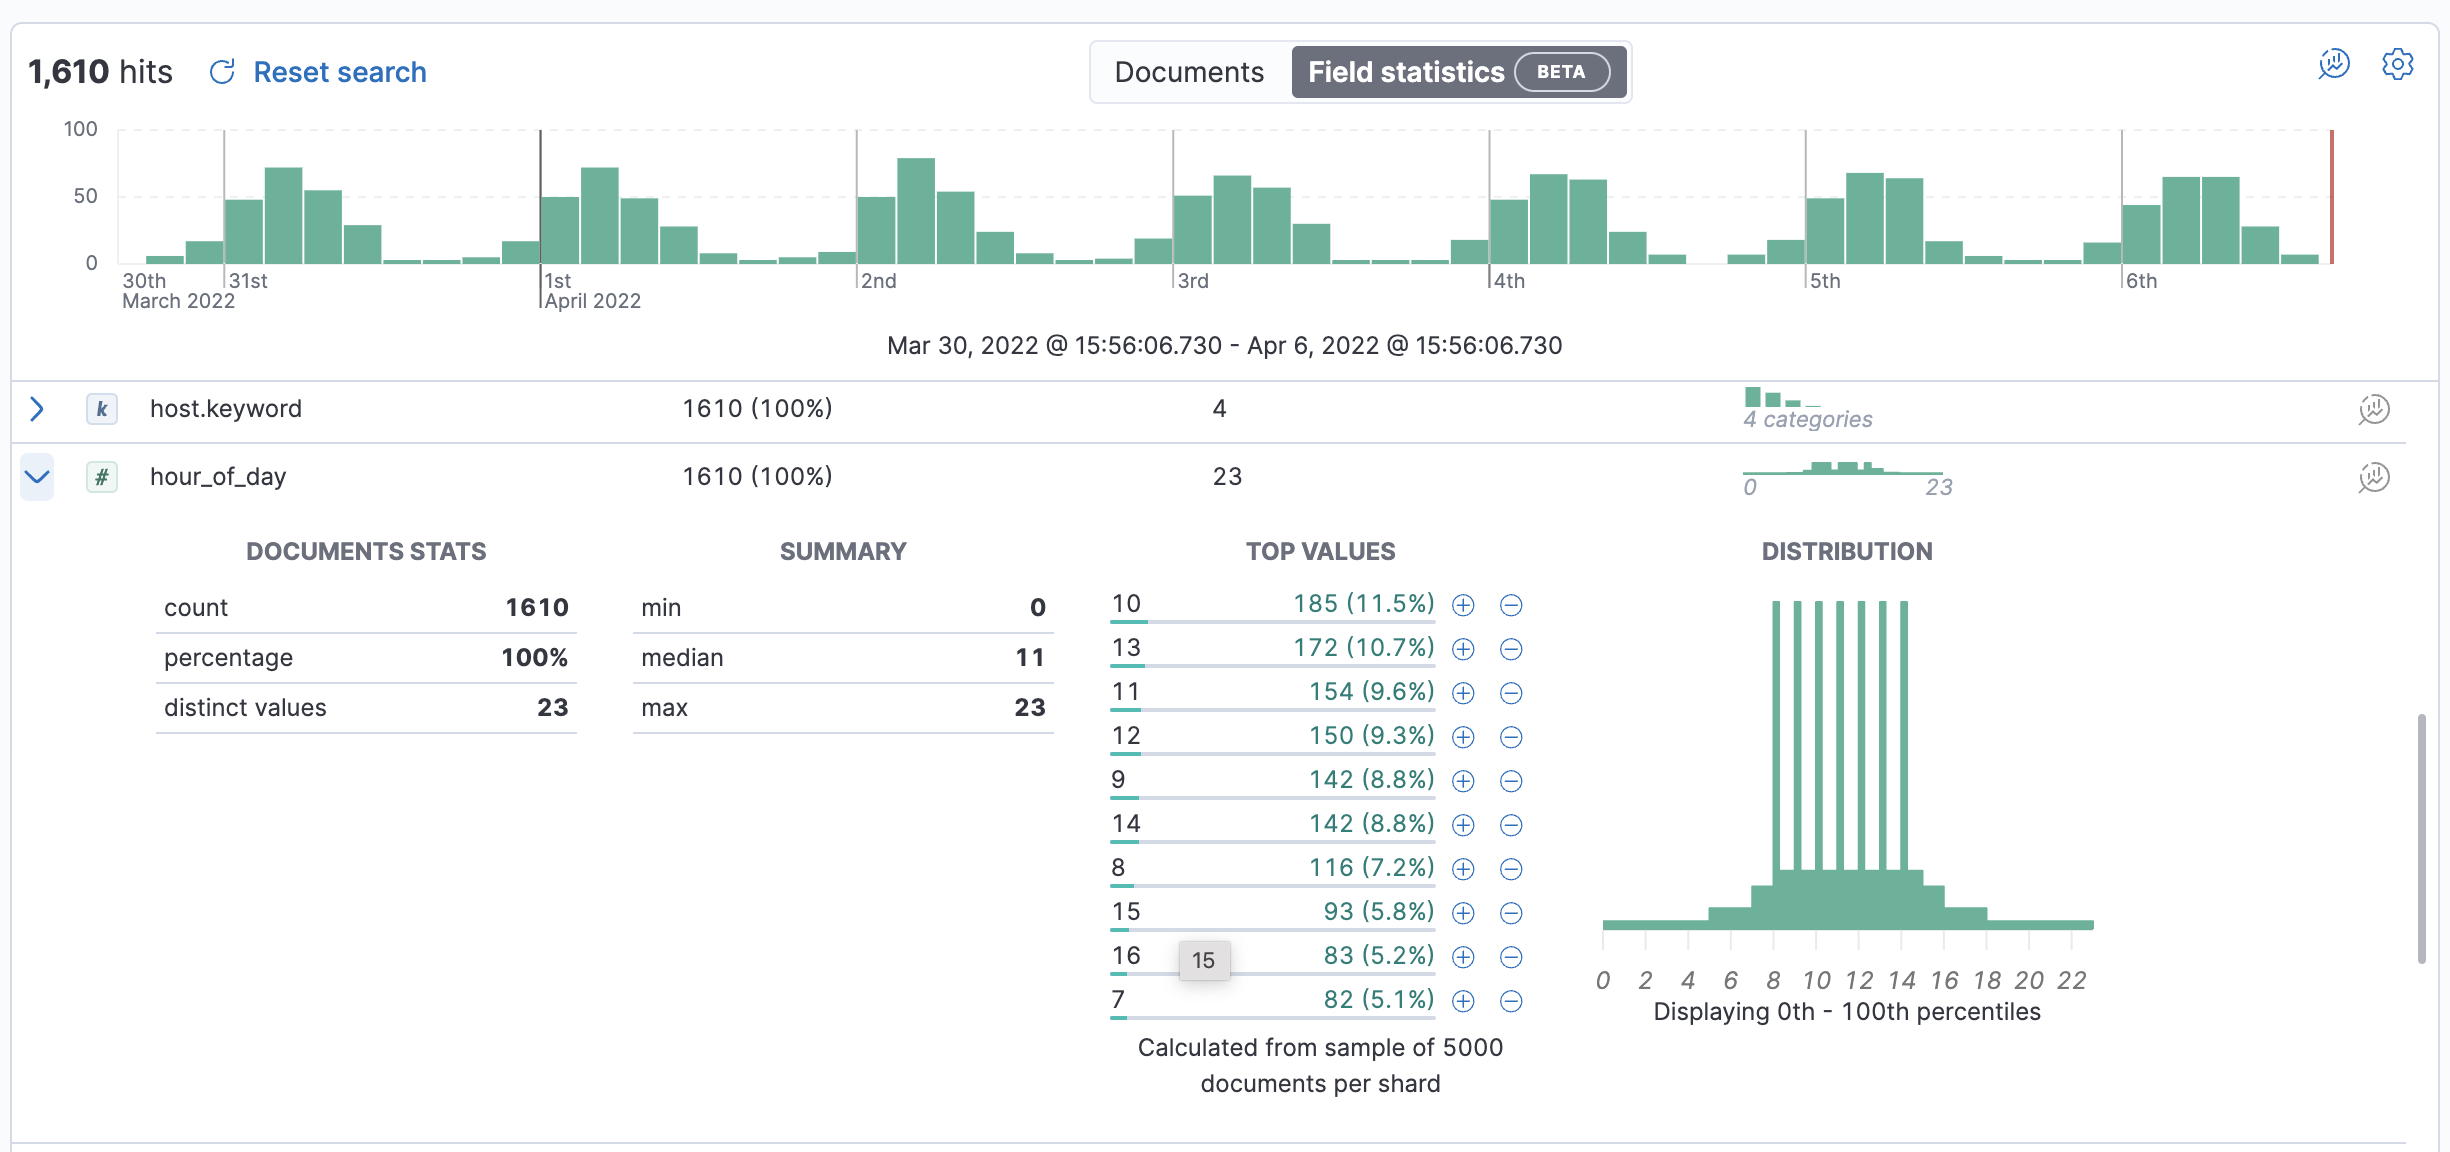
-
Expand the
hour_of_day
field.For numeric fields, Discover provides the document statistics, minimum, median, and maximum values, a list of top values, and a distribution chart. Use this chart to get a better idea of how the values in the data are clustered.
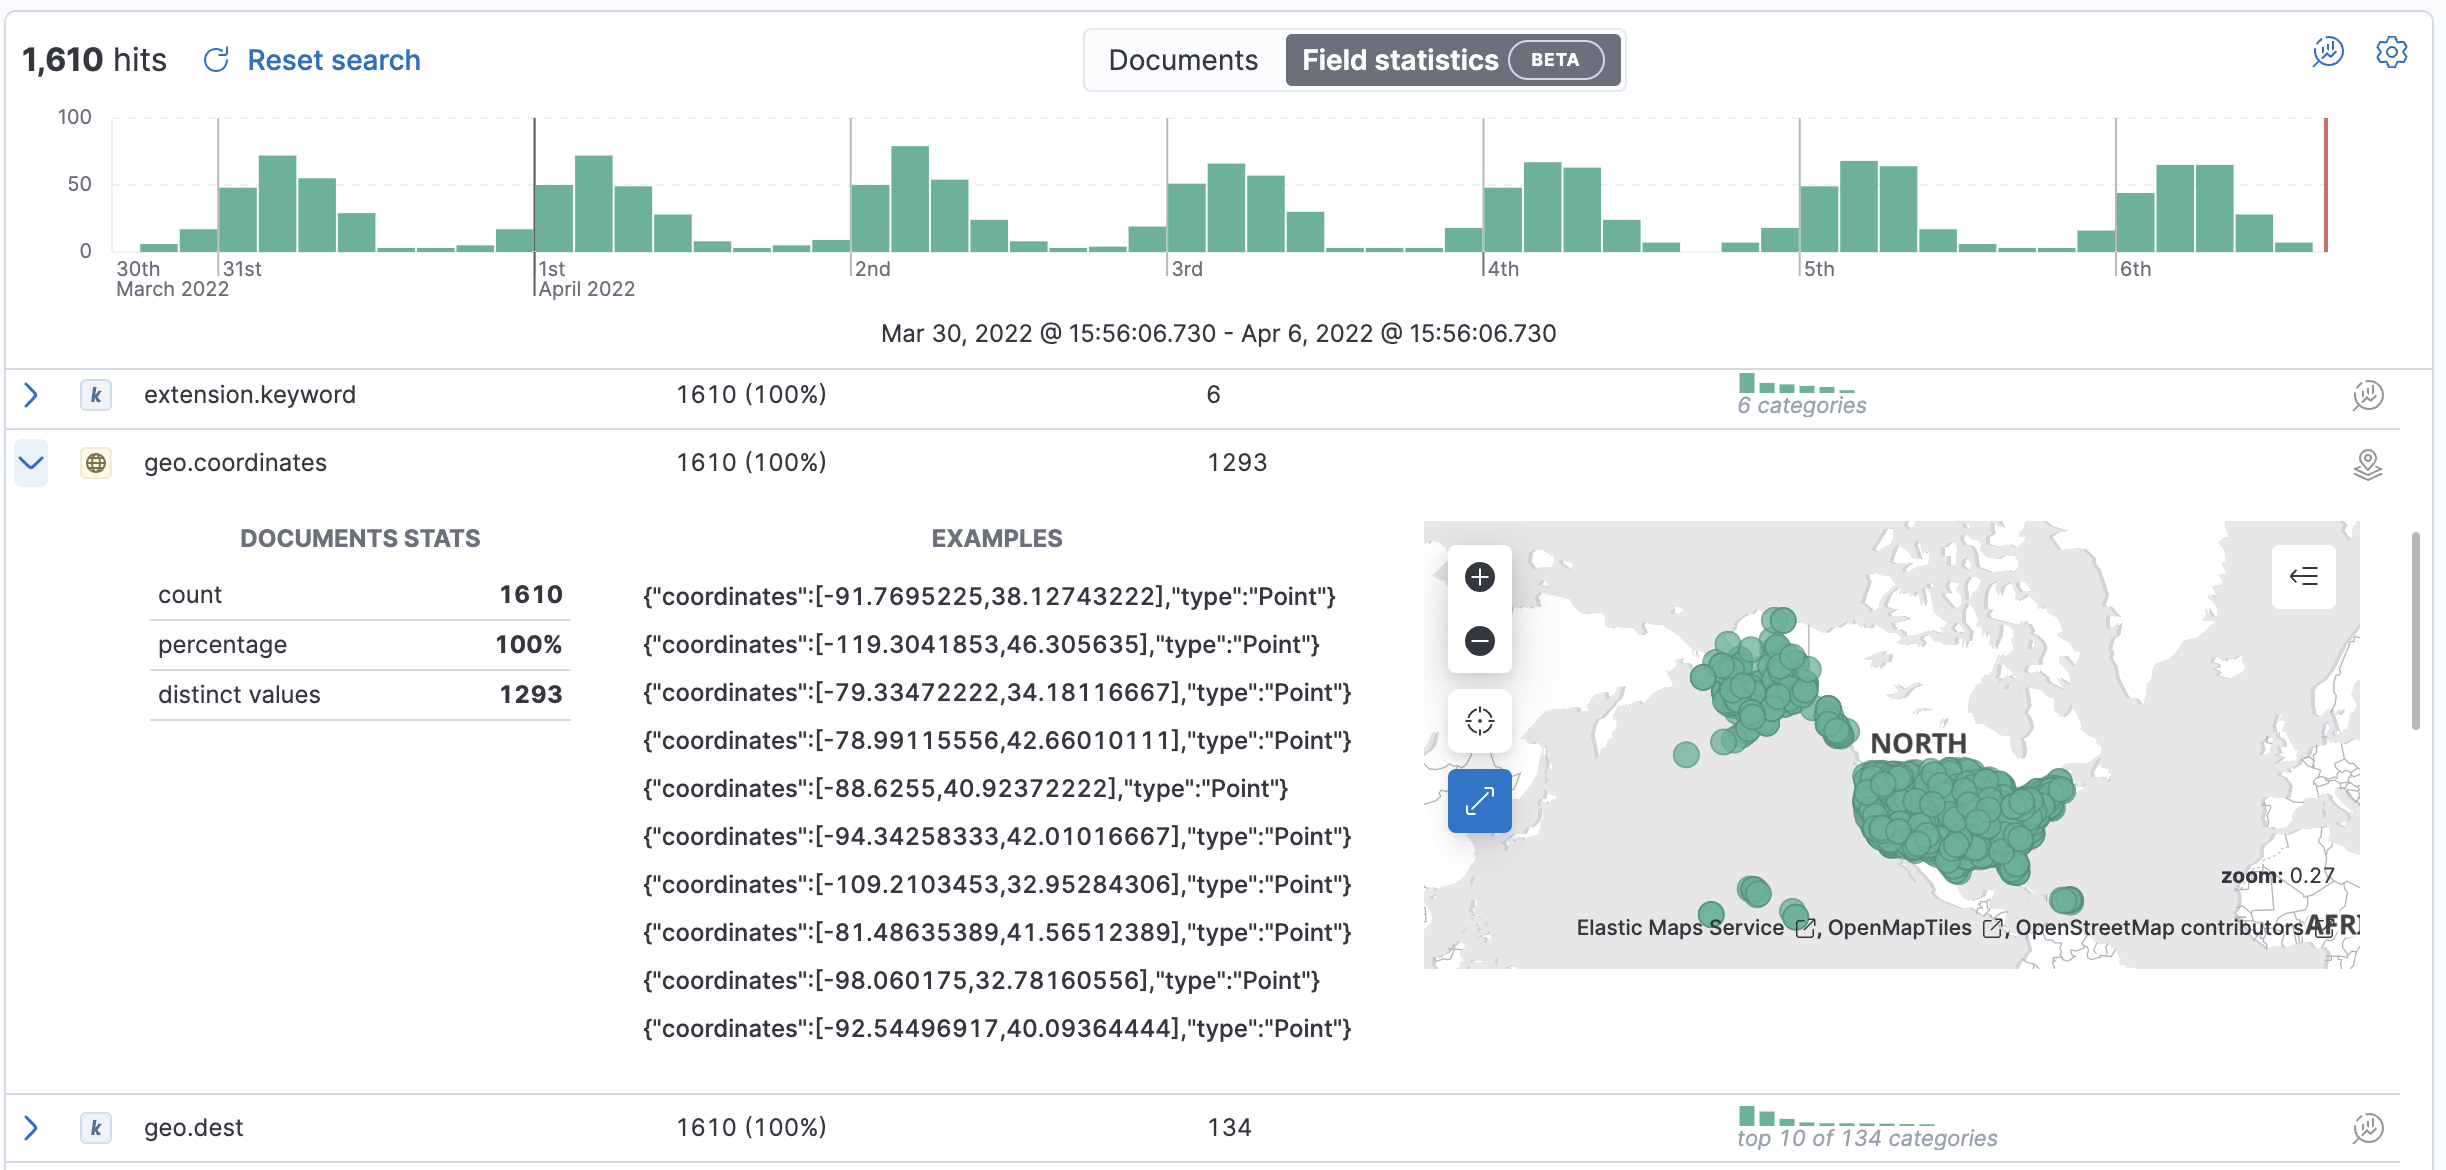
-
Expand the
geo.coordinates
field.For geo fields, Discover provides the document statistics, examples, and a map of the coordinates.
- Explore additional field types to see the statistics that Discover provides.
-
To create a visualization of the field data, click
or
in the Actions column.