- Kibana Guide: other versions:
- What is Kibana?
- What’s new in 8.2
- Kibana concepts
- Quick start
- Set up
- Install Kibana
- Configure Kibana
- Alerting and action settings
- APM settings
- Banners settings
- Enterprise Search settings
- Fleet settings
- i18n settings
- Logging settings
- Logs settings
- Metrics settings
- Monitoring settings
- Reporting settings
- Search sessions settings
- Secure settings
- Security settings
- Spaces settings
- Task Manager settings
- Telemetry settings
- URL drilldown settings
- Start and stop Kibana
- Access Kibana
- Securing access to Kibana
- Add data
- Upgrade Kibana
- Configure security
- Configure reporting
- Configure logging
- Configure monitoring
- Command line tools
- Production considerations
- Discover
- Dashboard and visualizations
- Canvas
- Maps
- Build a map to compare metrics by country or region
- Track, visualize, and alert on assets in real time
- Map custom regions with reverse geocoding
- Heat map layer
- Tile layer
- Vector layer
- Plot big data
- Search geographic data
- Configure map settings
- Connect to Elastic Maps Service
- Import geospatial data
- Troubleshoot
- Reporting and sharing
- Machine learning
- Graph
- Alerting
- Observability
- APM
- Security
- Dev Tools
- Fleet
- Osquery
- Stack Monitoring
- Stack Management
- REST API
- Get features API
- Kibana spaces APIs
- Kibana role management APIs
- User session management APIs
- Saved objects APIs
- Data views API
- Index patterns APIs
- Alerting APIs
- Action and connector APIs
- Cases APIs
- Import and export dashboard APIs
- Logstash configuration management APIs
- Machine learning APIs
- Short URLs APIs
- Get Task Manager health
- Upgrade assistant APIs
- Kibana plugins
- Troubleshooting
- Accessibility
- Release notes
- Developer guide
Errors
editErrors
editErrors are groups of exceptions with a similar exception or log message.
The Errors overview provides a high-level view of the exceptions that APM agents catch, or that users manually report with APM agent APIs. Like errors are grouped together to make it easy to quickly see which errors are affecting your services, and to take actions to rectify them.
A service returning a 5xx code from a request handler, controller, etc., will not create an exception that an APM agent can catch, and will therefore not show up in this view.
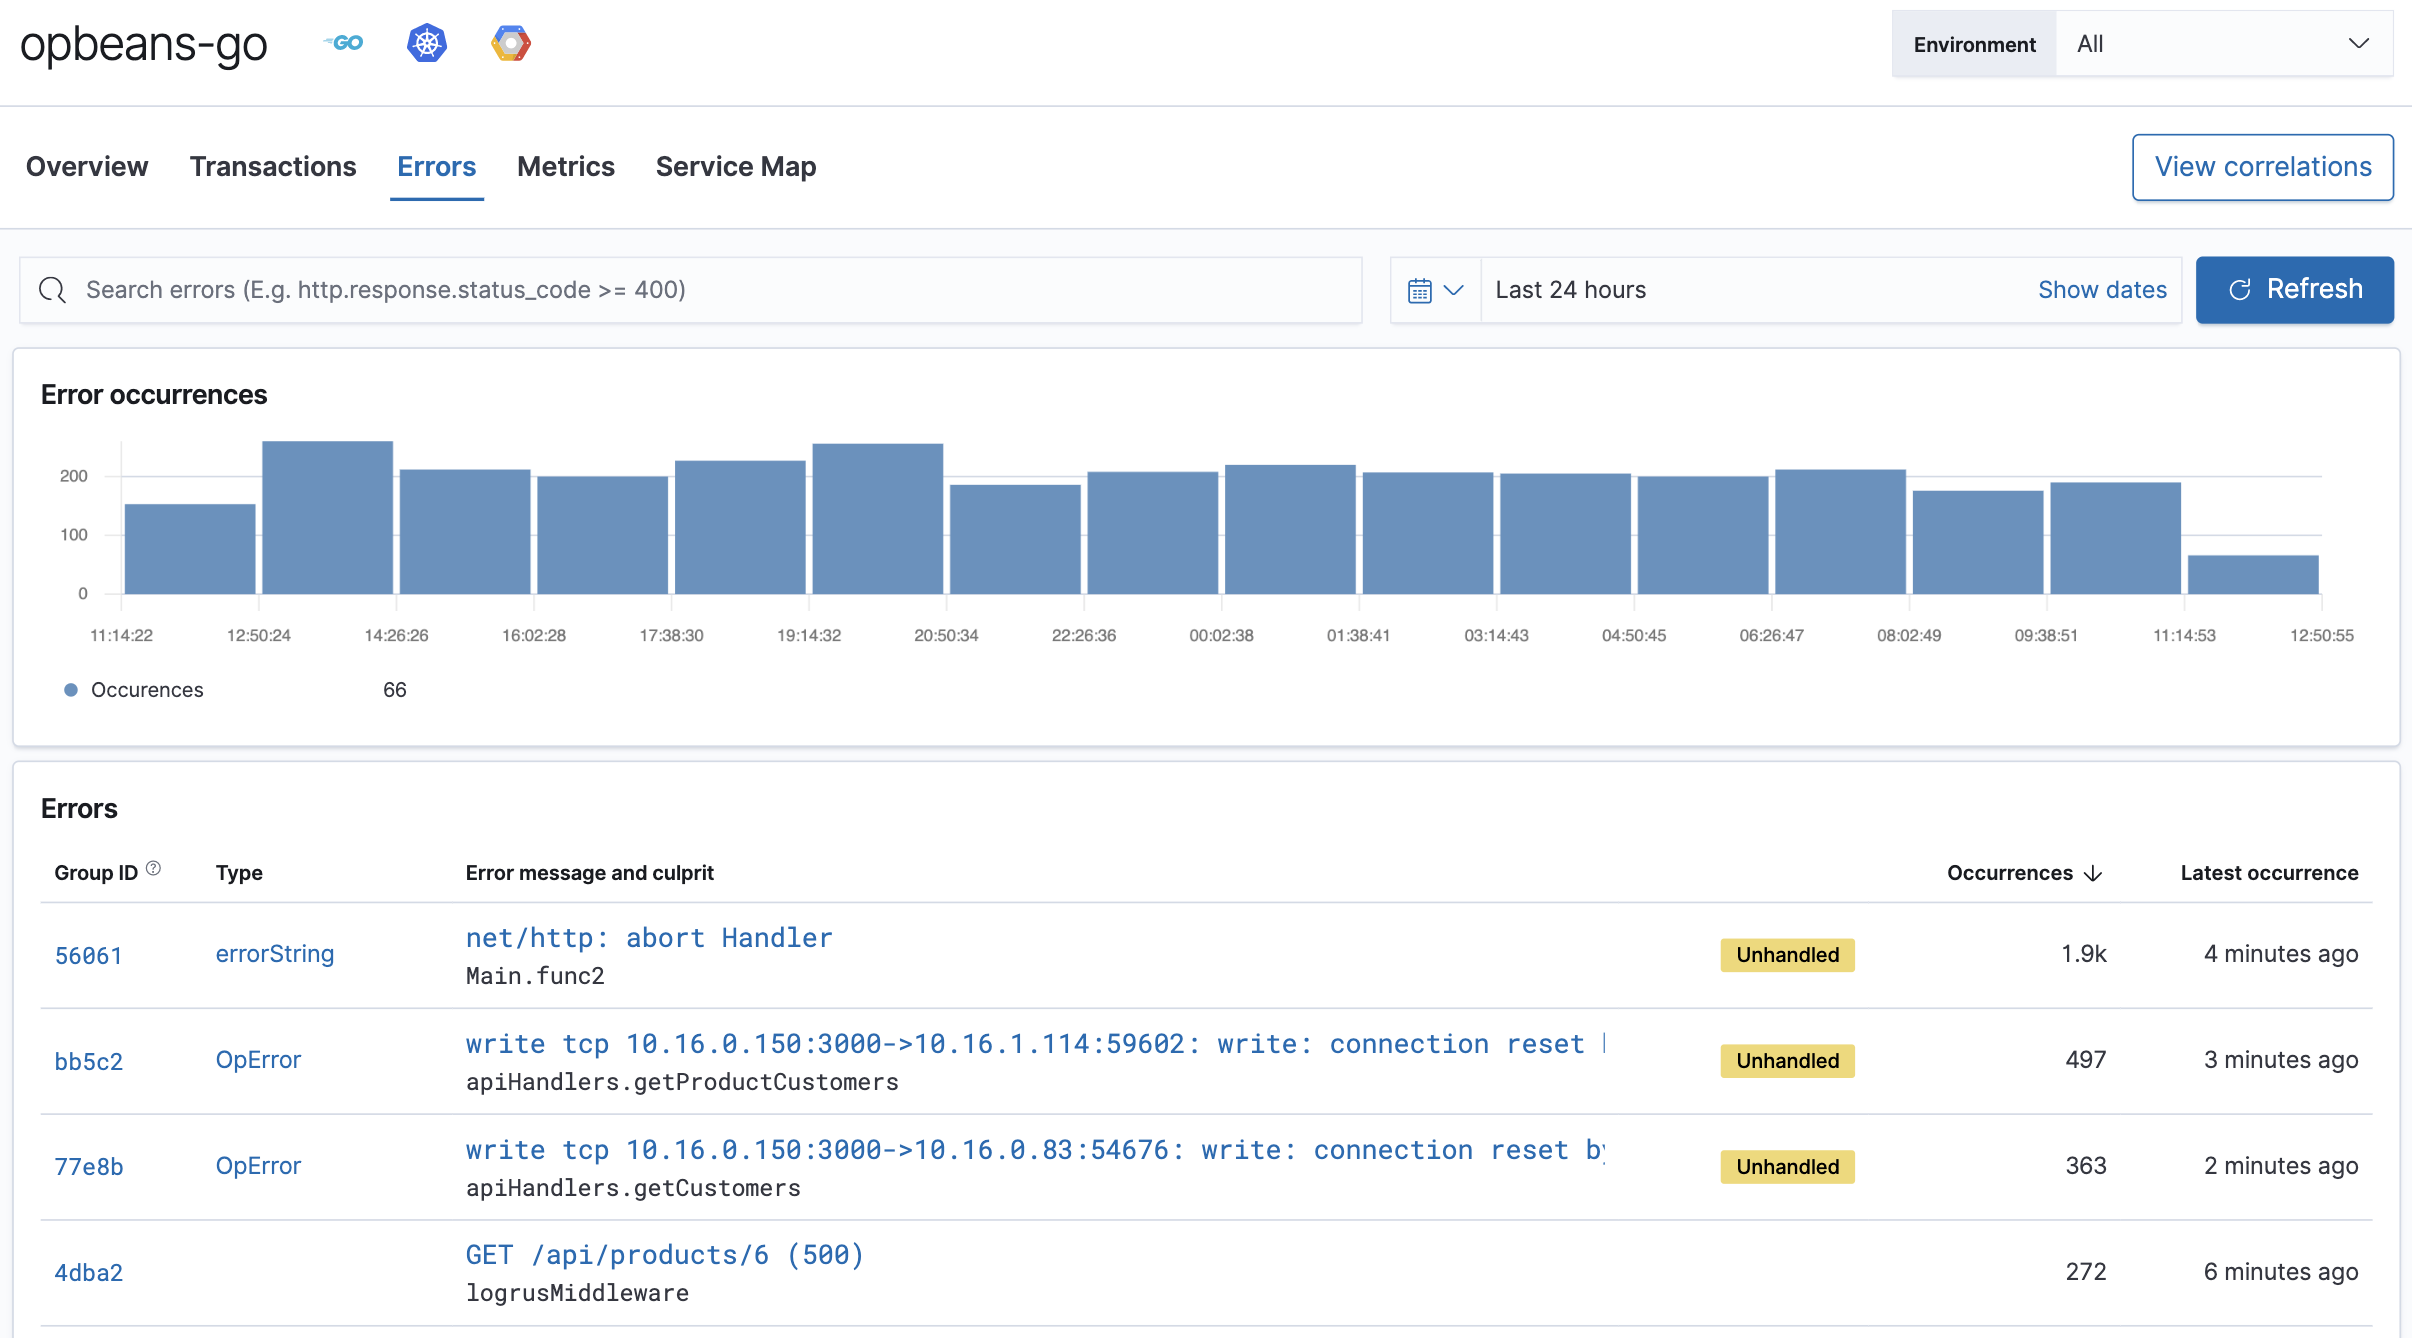
Selecting an error group ID or error message brings you to the Error group.
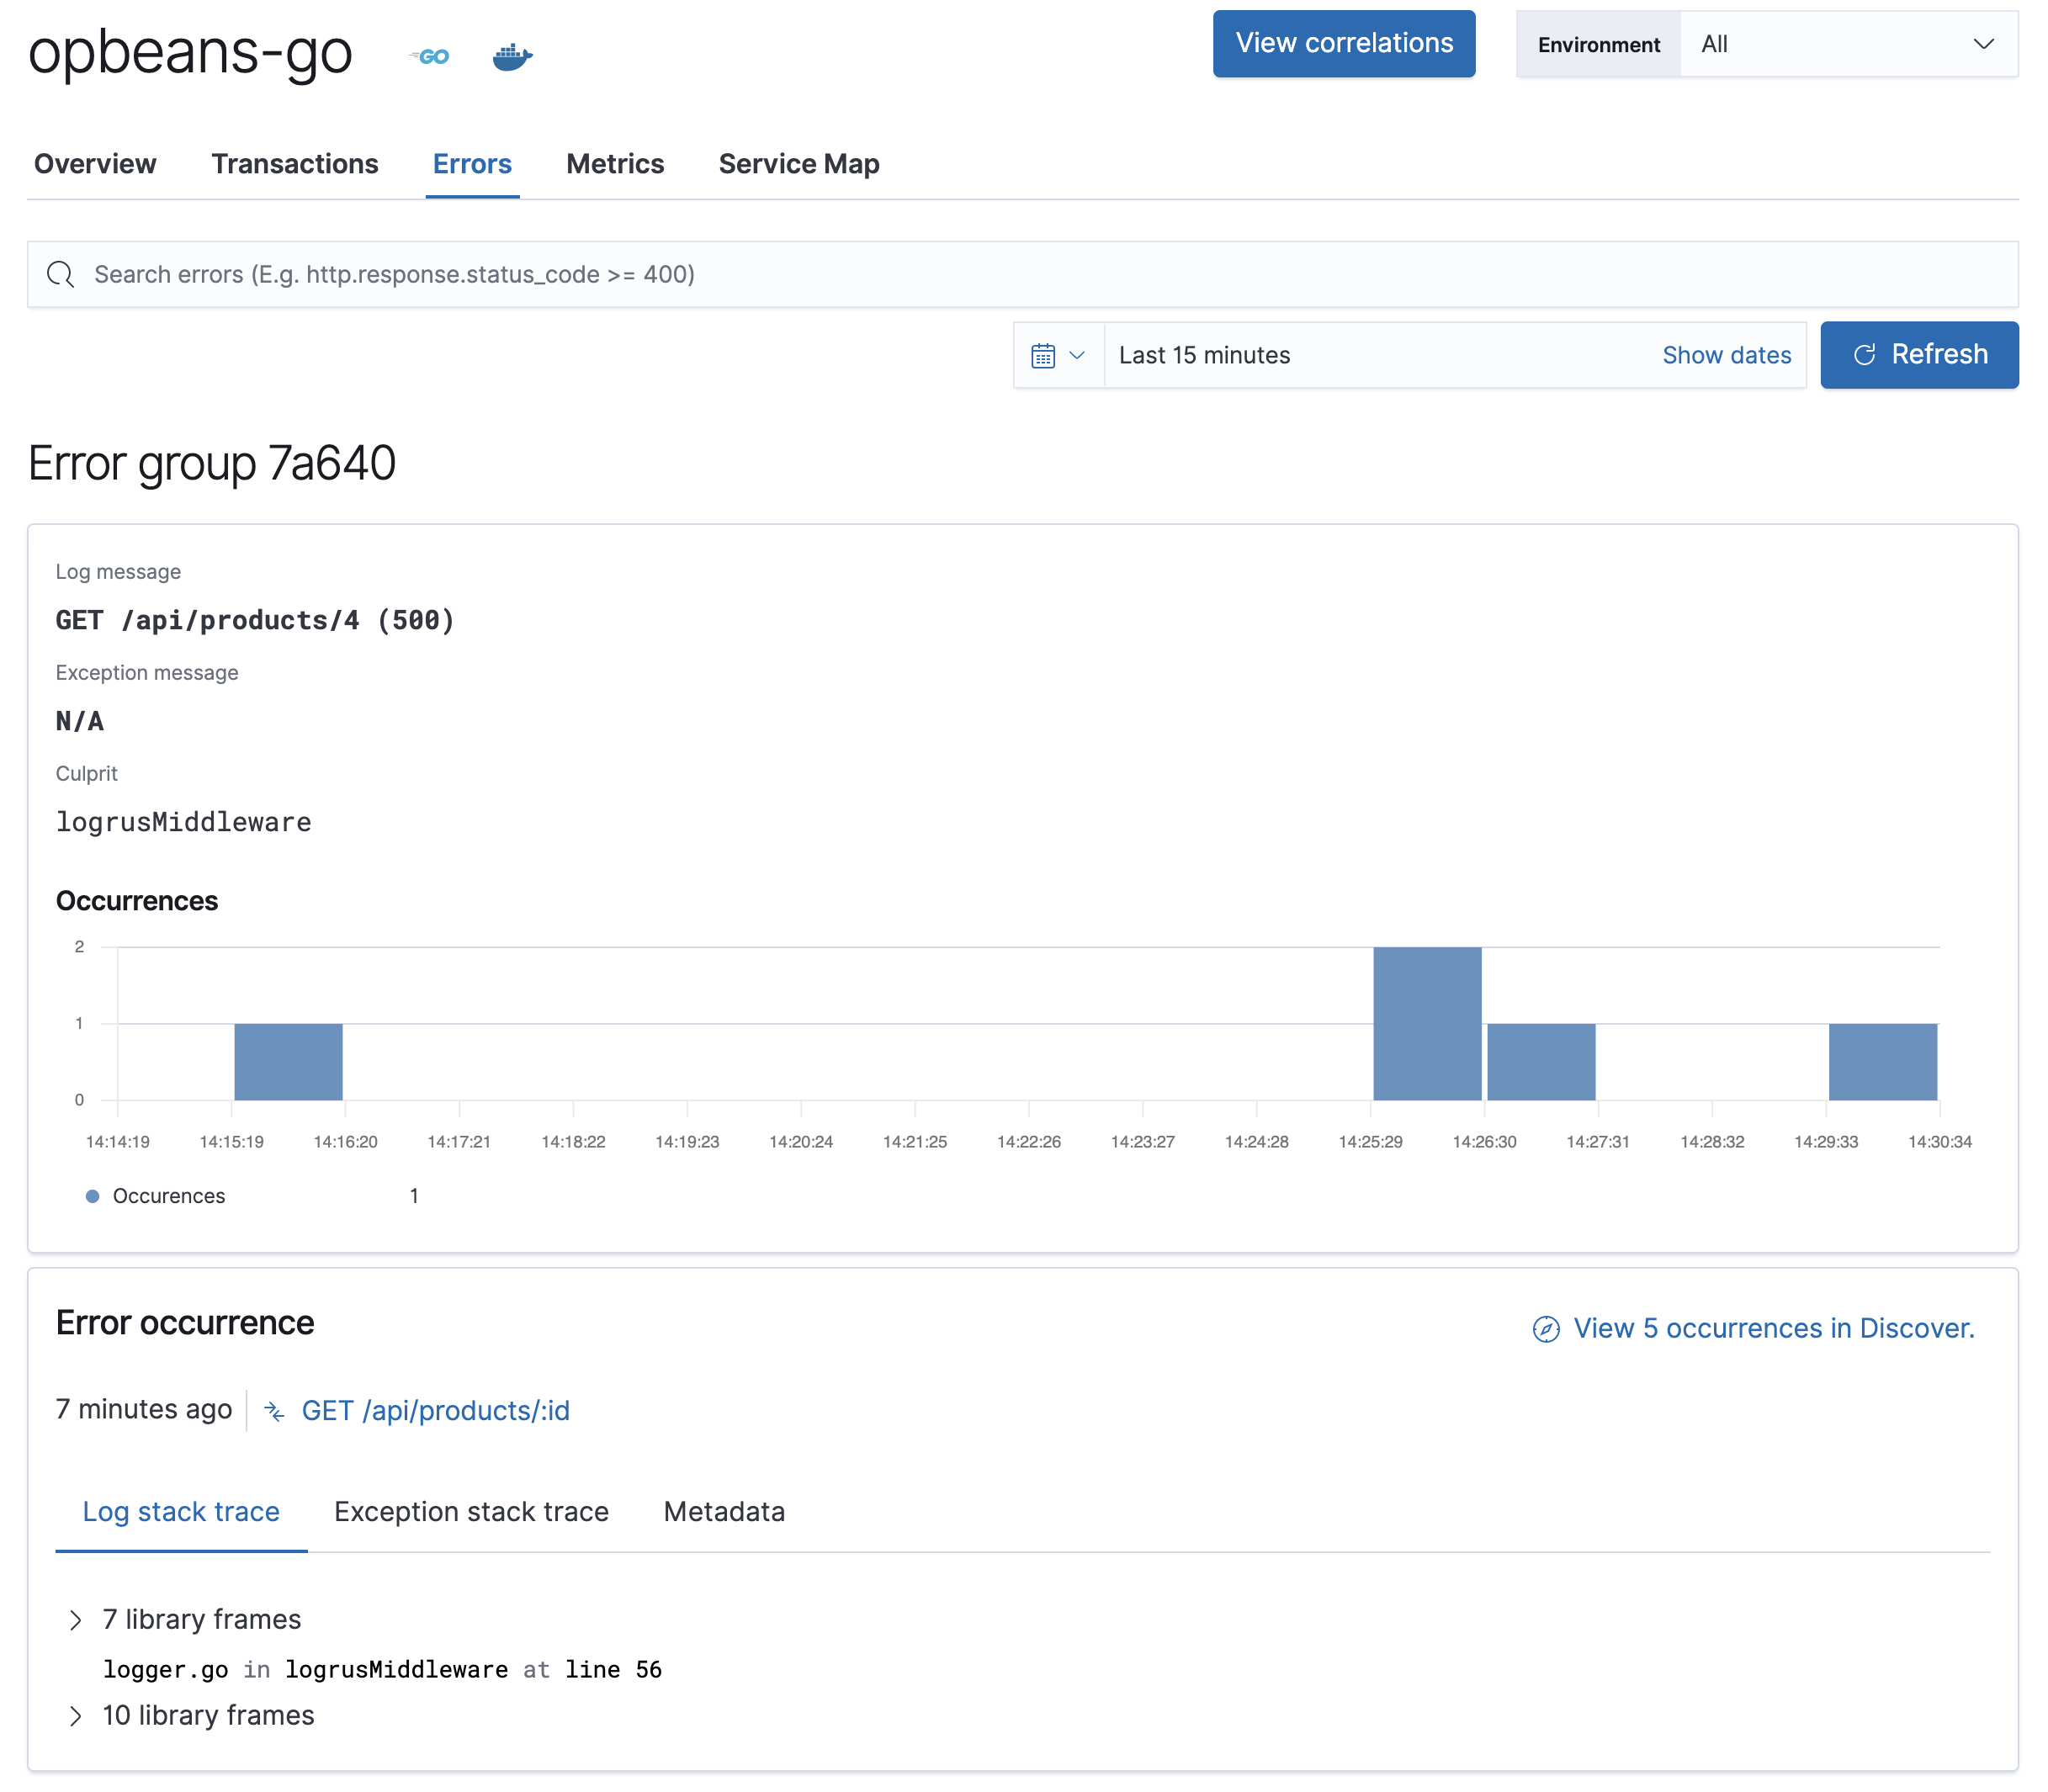
Here, you’ll see the error message, culprit, and the number of occurrences over time.
Further down, you’ll see the Error occurrence table. This table shows the details of a sampled error within this group. The error shown is always the most recent to occur.
Each error occurrence features a breakdown of the exception, including the stack trace from when the error occurred, and additional contextual information to help debug the issue. In some cases, you might also see a Transaction sample ID. This feature allows you to make a connection between the errors and transactions, by linking you to the specific transaction where the error occurred. This allows you to see the whole trace, including which services the request went through.