- Kibana Guide: other versions:
- What is Kibana?
- What’s new in 8.16
- Kibana concepts
- Quick start
- Set up
- Install Kibana
- Configure Kibana
- Alerting and action settings
- APM settings
- Banners settings
- Cases settings
- Enterprise Search settings
- Fleet settings
- i18n settings
- Logging settings
- Logs settings
- Metrics settings
- Monitoring settings
- Reporting settings
- Search sessions settings
- Secure settings
- Security settings
- Spaces settings
- Task Manager settings
- Telemetry settings
- URL drilldown settings
- Start and stop Kibana
- Access Kibana
- Securing access to Kibana
- Add data
- Upgrade Kibana
- Configure security
- Configure reporting
- Configure logging
- Configure monitoring
- Command line tools
- Production considerations
- Discover
- Dashboards
- Canvas
- Maps
- Build a map to compare metrics by country or region
- Track, visualize, and alert on assets in real time
- Map custom regions with reverse geocoding
- Heat map layer
- Tile layer
- Vector layer
- Plot big data
- Search geographic data
- Configure map settings
- Connect to Elastic Maps Service
- Import geospatial data
- Troubleshoot
- Reporting and sharing
- Machine learning
- Graph
- Alerting
- Observability
- Search
- Security
- Dev Tools
- Fleet
- Osquery
- Stack Monitoring
- Stack Management
- Cases
- Connectors
- Amazon Bedrock
- Cases
- CrowdStrike
- D3 Security
- Google Gemini
- IBM Resilient
- Index
- Jira
- Microsoft Teams
- Observability AI Assistant
- OpenAI
- Opsgenie
- PagerDuty
- SentinelOne
- Server log
- ServiceNow ITSM
- ServiceNow SecOps
- ServiceNow ITOM
- Swimlane
- Slack
- TheHive
- Tines
- Torq
- Webhook
- Webhook - Case Management
- xMatters
- Preconfigured connectors
- License Management
- Maintenance windows
- Manage data views
- Numeral Formatting
- Rollup Jobs
- Manage saved objects
- Security
- Spaces
- Advanced Settings
- Tags
- Upgrade Assistant
- Watcher
- REST API
- Get features API
- Kibana spaces APIs
- Kibana role management APIs
- User session management APIs
- Saved objects APIs
- Data views API
- Index patterns APIs
- Alerting APIs
- Action and connector APIs
- Cases APIs
- Import and export dashboard APIs
- Logstash configuration management APIs
- Machine learning APIs
- Osquery manager API
- Short URLs APIs
- Get Task Manager health
- Upgrade assistant APIs
- Synthetics APIs
- Uptime APIs
- Kibana plugins
- Troubleshooting
- Accessibility
- Release notes
- Upgrade notes
- Kibana 8.16.4
- Kibana 8.16.3
- Kibana 8.16.2
- Kibana 8.16.1
- Kibana 8.16.0
- Kibana 8.15.5
- Kibana 8.15.4
- Kibana 8.15.3
- Kibana 8.15.2
- Kibana 8.15.1
- Kibana 8.15.0
- Kibana 8.14.3
- Kibana 8.14.2
- Kibana 8.14.1
- Kibana 8.14.0
- Kibana 8.13.4
- Kibana 8.13.3
- Kibana 8.13.2
- Kibana 8.13.1
- Kibana 8.13.0
- Kibana 8.12.2
- Kibana 8.12.1
- Kibana 8.12.0
- Kibana 8.11.4
- Kibana 8.11.3
- Kibana 8.11.2
- Kibana 8.11.1
- Kibana 8.11.0
- Kibana 8.10.4
- Kibana 8.10.3
- Kibana 8.10.2
- Kibana 8.10.1
- Kibana 8.10.0
- Kibana 8.9.2
- Kibana 8.9.1
- Kibana 8.9.0
- Kibana 8.8.2
- Kibana 8.8.1
- Kibana 8.8.0
- Kibana 8.7.1
- Kibana 8.7.0
- Kibana 8.6.1
- Kibana 8.6.0
- Kibana 8.5.2
- Kibana 8.5.1
- Kibana 8.5.0
- Kibana 8.4.3
- Kibana 8.4.2
- Kibana 8.4.1
- Kibana 8.4.0
- Kibana 8.3.3
- Kibana 8.3.2
- Kibana 8.3.1
- Kibana 8.3.0
- Kibana 8.2.3
- Kibana 8.2.2
- Kibana 8.2.1
- Kibana 8.2.0
- Kibana 8.1.3
- Kibana 8.1.2
- Kibana 8.1.1
- Kibana 8.1.0
- Kibana 8.0.0
- Kibana 8.0.0-rc2
- Kibana 8.0.0-rc1
- Kibana 8.0.0-beta1
- Kibana 8.0.0-alpha2
- Kibana 8.0.0-alpha1
- Developer guide
IMPORTANT: No additional bug fixes or documentation updates
will be released for this version. For the latest information, see the
current release documentation.
Run a pattern analysis on your log data
editRun a pattern analysis on your log data
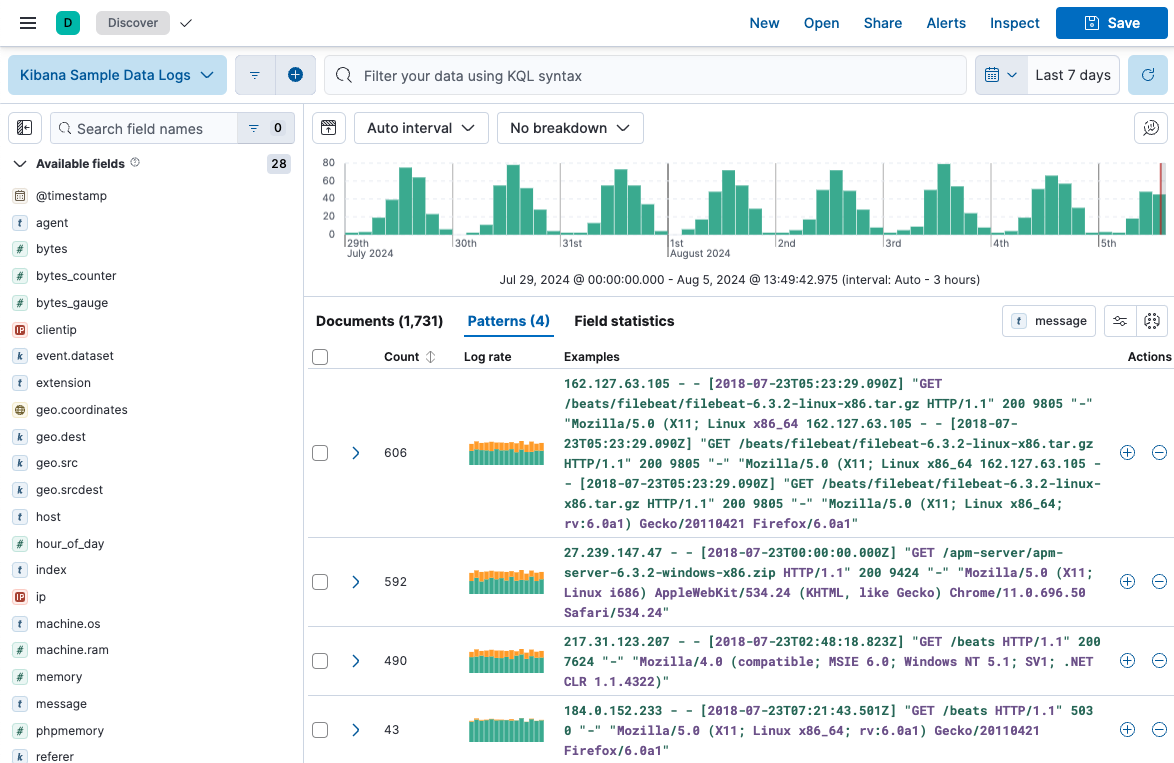
editLog pattern analysis helps you to find patterns in unstructured log messages and makes it easier to examine your data. It performs categorization analysis on a selected field of a data view, creates categories based on the data and displays them together with a chart that shows the distribution of each category and an example document that matches the category.
Log pattern analysis works on every text field.
This example uses the sample web logs data, or you can use your own data.
- Go to Discover.
- Expand the data view dropdown, and select Kibana Sample Data Logs.
- If you don’t see any results, expand the time range, for example, to Last 15 days.
- Click the Patterns tab next to Documents and Field statistics. The pattern analysis starts. The results are displayed under the chart. You can change the analyzed field by using the field selector. In the Pattern analysis menu, you can change the Minimum time range. This option enables you to widen the time range for calculating patterns which improves accuracy. The patterns, however, are still displayed by the time range you selected in step 3.
- (optional) Apply filters to one or more patterns. Discover only displays documents that match the selected patterns. Additionally, you can remove selected patterns from Discover, resulting in the display of only those documents that don’t match the selected pattern. These options enable you to remove unimportant messages and focus on the more important, actionable data during troubleshooting. You can also create a categorization anomaly detection job directly from the Patterns tab to find anomalous behavior in the selected pattern.
Was this helpful?
Thank you for your feedback.