- Kibana Guide: other versions:
- What is Kibana?
- What’s new in 8.16
- Kibana concepts
- Quick start
- Set up
- Install Kibana
- Configure Kibana
- Alerting and action settings
- APM settings
- Banners settings
- Cases settings
- Enterprise Search settings
- Fleet settings
- i18n settings
- Logging settings
- Logs settings
- Metrics settings
- Monitoring settings
- Reporting settings
- Search sessions settings
- Secure settings
- Security settings
- Spaces settings
- Task Manager settings
- Telemetry settings
- URL drilldown settings
- Start and stop Kibana
- Access Kibana
- Securing access to Kibana
- Add data
- Upgrade Kibana
- Configure security
- Configure reporting
- Configure logging
- Configure monitoring
- Command line tools
- Production considerations
- Discover
- Dashboards
- Canvas
- Maps
- Build a map to compare metrics by country or region
- Track, visualize, and alert on assets in real time
- Map custom regions with reverse geocoding
- Heat map layer
- Tile layer
- Vector layer
- Plot big data
- Search geographic data
- Configure map settings
- Connect to Elastic Maps Service
- Import geospatial data
- Troubleshoot
- Reporting and sharing
- Machine learning
- Graph
- Alerting
- Observability
- Search
- Security
- Dev Tools
- Fleet
- Osquery
- Stack Monitoring
- Stack Management
- Cases
- Connectors
- Amazon Bedrock
- Cases
- CrowdStrike
- D3 Security
- Google Gemini
- IBM Resilient
- Index
- Jira
- Microsoft Teams
- Observability AI Assistant
- OpenAI
- Opsgenie
- PagerDuty
- SentinelOne
- Server log
- ServiceNow ITSM
- ServiceNow SecOps
- ServiceNow ITOM
- Swimlane
- Slack
- TheHive
- Tines
- Torq
- Webhook
- Webhook - Case Management
- xMatters
- Preconfigured connectors
- License Management
- Maintenance windows
- Manage data views
- Numeral Formatting
- Rollup Jobs
- Manage saved objects
- Security
- Spaces
- Advanced Settings
- Tags
- Upgrade Assistant
- Watcher
- REST API
- Get features API
- Kibana spaces APIs
- Kibana role management APIs
- User session management APIs
- Saved objects APIs
- Data views API
- Index patterns APIs
- Alerting APIs
- Action and connector APIs
- Cases APIs
- Import and export dashboard APIs
- Logstash configuration management APIs
- Machine learning APIs
- Osquery manager API
- Short URLs APIs
- Get Task Manager health
- Upgrade assistant APIs
- Synthetics APIs
- Uptime APIs
- Kibana plugins
- Troubleshooting
- Accessibility
- Release notes
- Upgrade notes
- Kibana 8.16.4
- Kibana 8.16.3
- Kibana 8.16.2
- Kibana 8.16.1
- Kibana 8.16.0
- Kibana 8.15.5
- Kibana 8.15.4
- Kibana 8.15.3
- Kibana 8.15.2
- Kibana 8.15.1
- Kibana 8.15.0
- Kibana 8.14.3
- Kibana 8.14.2
- Kibana 8.14.1
- Kibana 8.14.0
- Kibana 8.13.4
- Kibana 8.13.3
- Kibana 8.13.2
- Kibana 8.13.1
- Kibana 8.13.0
- Kibana 8.12.2
- Kibana 8.12.1
- Kibana 8.12.0
- Kibana 8.11.4
- Kibana 8.11.3
- Kibana 8.11.2
- Kibana 8.11.1
- Kibana 8.11.0
- Kibana 8.10.4
- Kibana 8.10.3
- Kibana 8.10.2
- Kibana 8.10.1
- Kibana 8.10.0
- Kibana 8.9.2
- Kibana 8.9.1
- Kibana 8.9.0
- Kibana 8.8.2
- Kibana 8.8.1
- Kibana 8.8.0
- Kibana 8.7.1
- Kibana 8.7.0
- Kibana 8.6.1
- Kibana 8.6.0
- Kibana 8.5.2
- Kibana 8.5.1
- Kibana 8.5.0
- Kibana 8.4.3
- Kibana 8.4.2
- Kibana 8.4.1
- Kibana 8.4.0
- Kibana 8.3.3
- Kibana 8.3.2
- Kibana 8.3.1
- Kibana 8.3.0
- Kibana 8.2.3
- Kibana 8.2.2
- Kibana 8.2.1
- Kibana 8.2.0
- Kibana 8.1.3
- Kibana 8.1.2
- Kibana 8.1.1
- Kibana 8.1.0
- Kibana 8.0.0
- Kibana 8.0.0-rc2
- Kibana 8.0.0-rc1
- Kibana 8.0.0-beta1
- Kibana 8.0.0-alpha2
- Kibana 8.0.0-alpha1
- Developer guide
Manage dashboards
editManage dashboards
editBrowse dashboards
editWhen looking for specific dashboards to open or share, several actions are available to you to help you find them quicker.
Search by name, description, or tag
On your list of Dashboards, use the search field to look for specific terms. These terms will be highlighted in real time in your dashboard list to help you locate what’s relevant to you.
Filter by tag
When creating or editing dashboards, you can assign them tags that allow you to retrieve them faster in the future.
On your dashboard list, you have an option that lets you filter dashboards in or out based on their tags.
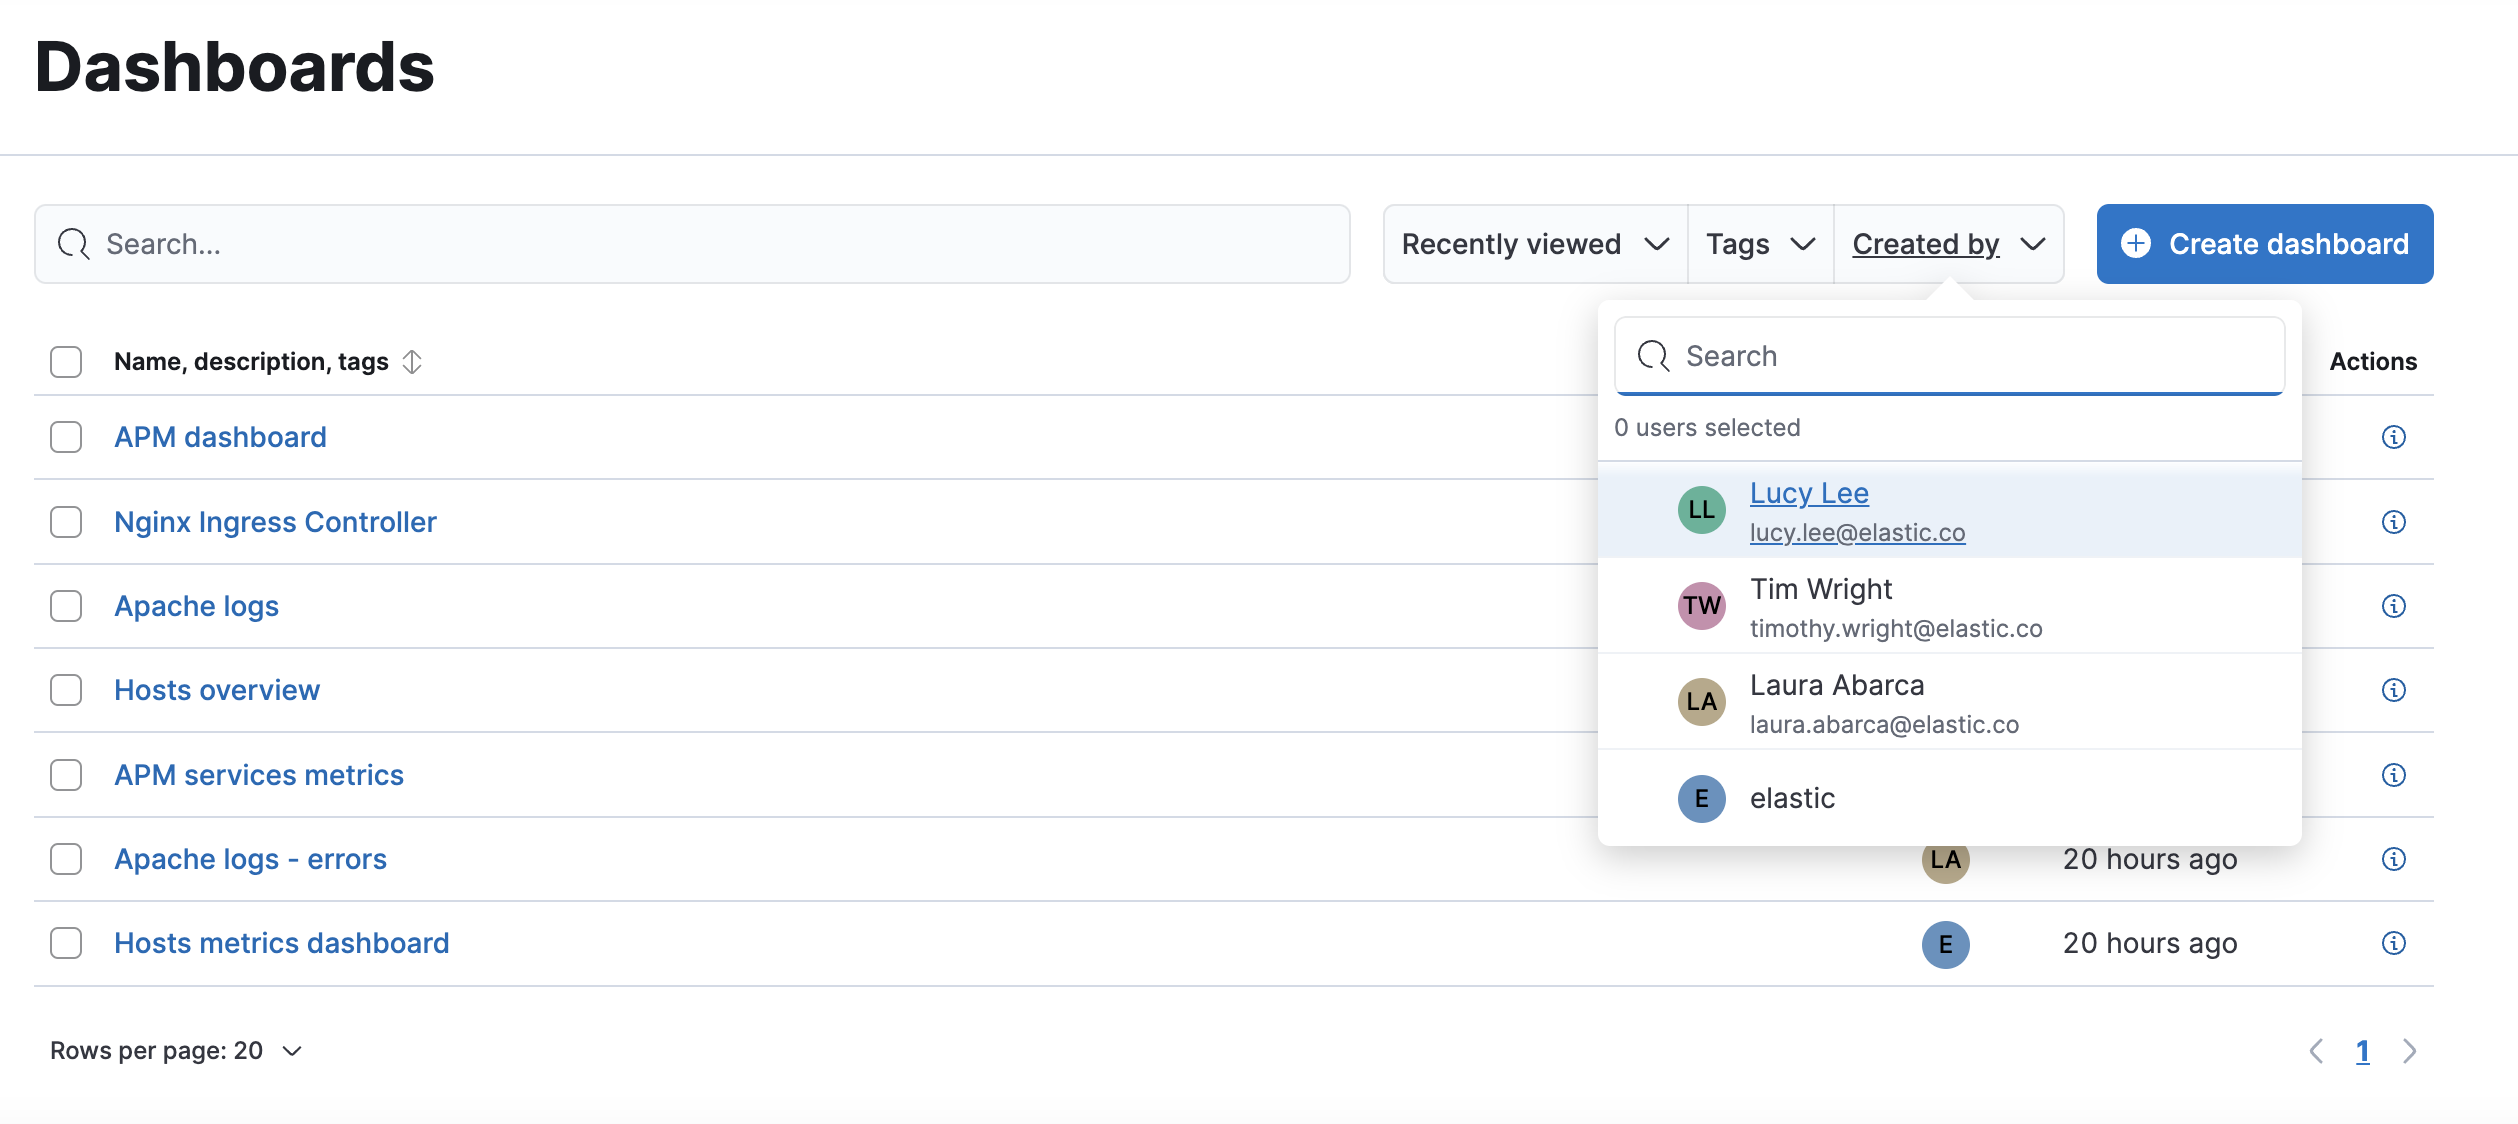
Filter by creator
The user who created or imported a dashboard is identified as the dashboard’s creator. This information is visible right from the dashboard list, and you can filter that list by creator.
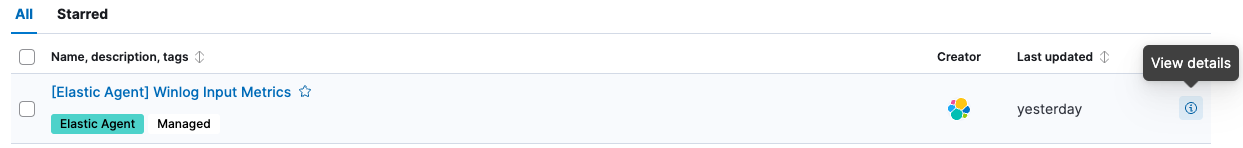
Similarly, managed dashboards created by integrations are identified as created by Elastic.
The creator information is only available for dashboards created on or after version 8.14. For dashboards from previous versions, the creator is empty.
Sort by name or last update date
By default, your most recently viewed dashboards are displayed first. You can instead sort the dashboard list based on their name or their last update date.
Keep track of your favorite dashboards
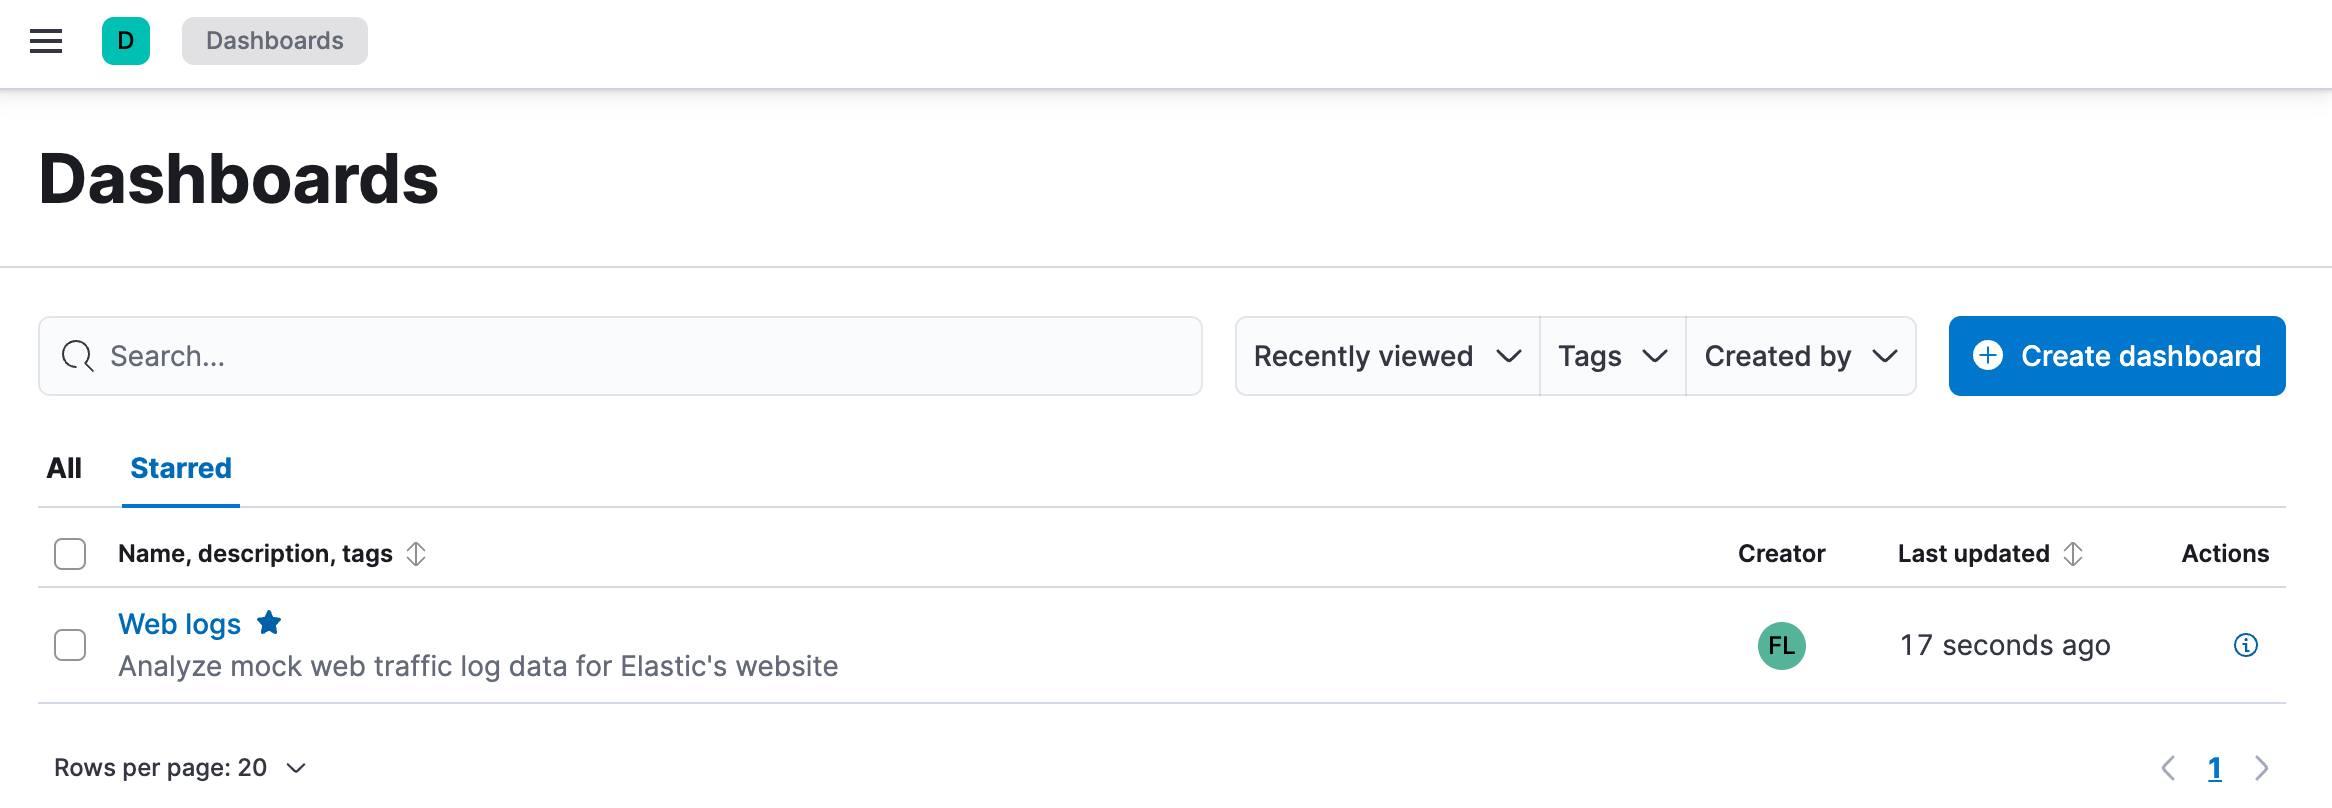
editYou can mark any dashboards as favorite, using the ✩ star icon.
All dashboards marked as favorite are gathered in the Starred tab so you can find them quickly.
The list of starred dashboards is personal. Dashboards marked as favorite by other users only appear for those users.
View dashboard usage
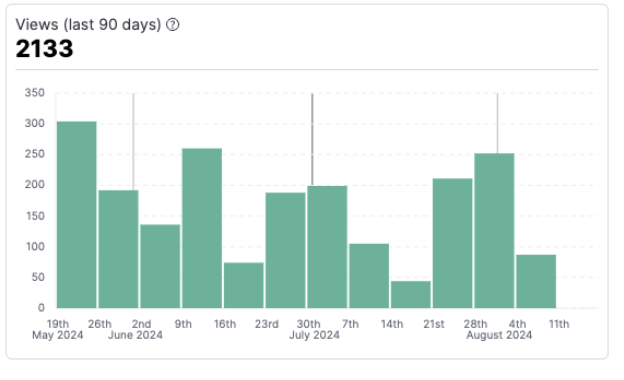
editYou can check how much a dashboard is being used by clicking its View details icon in your list of dashboards.
These details include a graph showing the total number of views during the last 90 days.