- Kibana Guide: other versions:
- What is Kibana?
- What’s new in 8.13
- Kibana concepts
- Quick start
- Set up
- Install Kibana
- Configure Kibana
- Alerting and action settings
- APM settings
- Banners settings
- Cases settings
- Enterprise Search settings
- Fleet settings
- i18n settings
- Logging settings
- Logs settings
- Metrics settings
- Monitoring settings
- Reporting settings
- Search sessions settings
- Secure settings
- Security settings
- Spaces settings
- Task Manager settings
- Telemetry settings
- URL drilldown settings
- Start and stop Kibana
- Access Kibana
- Securing access to Kibana
- Add data
- Upgrade Kibana
- Configure security
- Configure reporting
- Configure logging
- Configure monitoring
- Command line tools
- Production considerations
- Discover
- Dashboard and visualizations
- Canvas
- Maps
- Build a map to compare metrics by country or region
- Track, visualize, and alert on assets in real time
- Map custom regions with reverse geocoding
- Heat map layer
- Tile layer
- Vector layer
- Plot big data
- Search geographic data
- Configure map settings
- Connect to Elastic Maps Service
- Import geospatial data
- Troubleshoot
- Reporting and sharing
- Machine learning
- Graph
- Alerting
- Observability
- APM
- Set up
- Get started
- How-to guides
- Configure APM agents with central config
- Control access to APM data
- Create an alert
- Create custom links
- Filter data
- Find transaction latency and failure correlations
- Identify deployment details for APM agents
- Integrate with machine learning
- Exploring mobile sessions with Discover
- Viewing sessions with Discover
- Observe Lambda functions
- Query your data
- Storage Explorer
- Track deployments with annotations
- Users and privileges
- Settings
- REST API
- Troubleshooting
- Security
- Dev Tools
- Fleet
- Osquery
- Stack Monitoring
- Stack Management
- REST API
- Get features API
- Kibana spaces APIs
- Kibana role management APIs
- User session management APIs
- Saved objects APIs
- Data views API
- Get all data views
- Get data view
- Create data view
- Update data view
- Delete data view
- Swap references preview
- Swap references
- Get default data view
- Set default data view
- Update data view fields metadata
- Get runtime field
- Create runtime field
- Upsert runtime field
- Update runtime field
- Delete runtime field
- Index patterns APIs
- Alerting APIs
- Action and connector APIs
- Cases APIs
- Add comment
- Create case
- Delete cases
- Delete comments
- Find case activity
- Find cases
- Find connectors
- Get alerts
- Get case activity
- Get case
- Get case status
- Get cases by alert
- Get comments
- Get configuration
- Get reporters
- Get tags
- Push case
- Set configuration
- Update cases
- Update comment
- Update configuration
- Import and export dashboard APIs
- Logstash configuration management APIs
- Machine learning APIs
- Osquery manager API
- Short URLs APIs
- Get Task Manager health
- Upgrade assistant APIs
- Synthetics APIs
- Uptime APIs
- Kibana plugins
- Troubleshooting
- Accessibility
- Release notes
- Kibana 8.13.4
- Kibana 8.13.3
- Kibana 8.13.2
- Kibana 8.13.1
- Kibana 8.13.0
- Kibana 8.12.2
- Kibana 8.12.1
- Kibana 8.12.0
- Kibana 8.11.4
- Kibana 8.11.3
- Kibana 8.11.2
- Kibana 8.11.1
- Kibana 8.11.0
- Kibana 8.10.4
- Kibana 8.10.3
- Kibana 8.10.2
- Kibana 8.10.1
- Kibana 8.10.0
- Kibana 8.9.2
- Kibana 8.9.1
- Kibana 8.9.0
- Kibana 8.8.2
- Kibana 8.8.1
- Kibana 8.8.0
- Kibana 8.7.1
- Kibana 8.7.0
- Kibana 8.6.1
- Kibana 8.6.0
- Kibana 8.5.2
- Kibana 8.5.1
- Kibana 8.5.0
- Kibana 8.4.3
- Kibana 8.4.2
- Kibana 8.4.1
- Kibana 8.4.0
- Kibana 8.3.3
- Kibana 8.3.2
- Kibana 8.3.1
- Kibana 8.3.0
- Kibana 8.2.3
- Kibana 8.2.2
- Kibana 8.2.1
- Kibana 8.2.0
- Kibana 8.1.3
- Kibana 8.1.2
- Kibana 8.1.1
- Kibana 8.1.0
- Kibana 8.0.0
- Kibana 8.0.0-rc2
- Kibana 8.0.0-rc1
- Kibana 8.0.0-beta1
- Kibana 8.0.0-alpha2
- Kibana 8.0.0-alpha1
- Developer guide
OpenAI connector and action
editOpenAI connector and action
editThe OpenAI connector uses axios to send a POST request to an OpenAI provider, either OpenAI or Azure OpenAI. The connector uses the run connector API to send the request.
Create connectors in Kibana
editYou can create connectors in Stack Management > Connectors. For example:
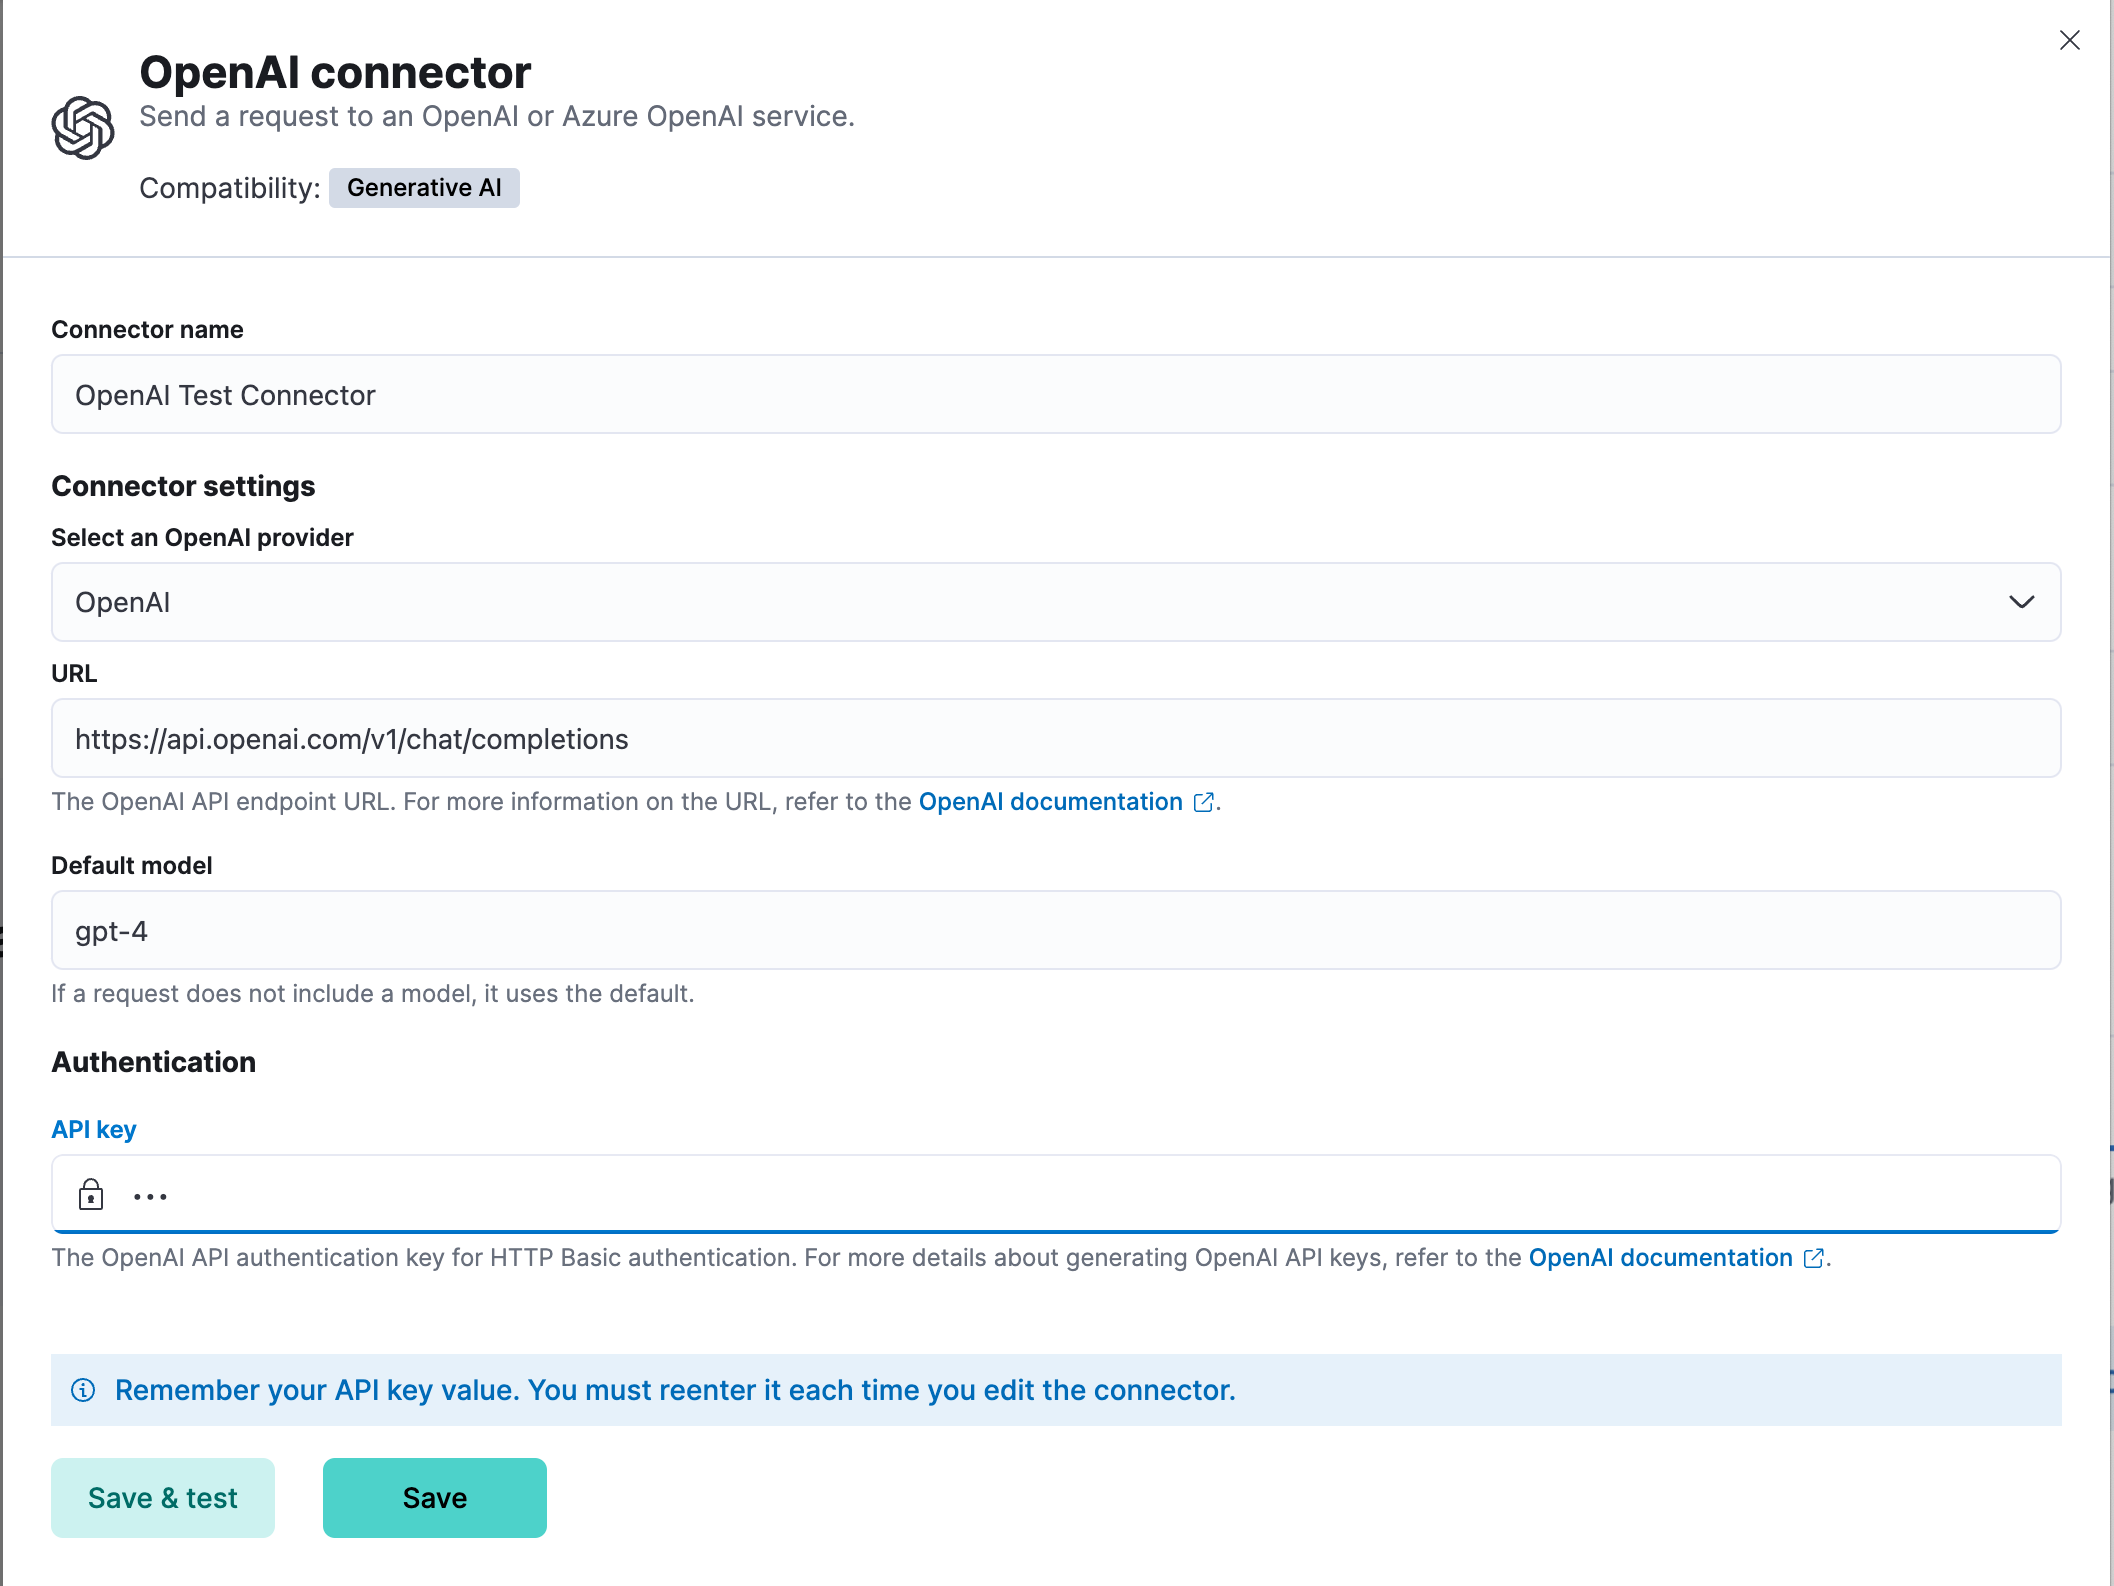
Connector configuration
editOpenAI connectors have the following configuration properties:
- Name
- The name of the connector.
- OpenAI provider
- The OpenAI API provider, either OpenAI or Azure OpenAI.
- URL
- The OpenAI request URL.
- Default model
-
(optional) The default model to use for requests. This option is available only when the provider is
OpenAI
. - API key
- The OpenAI or Azure OpenAI API key for authentication.
Test connectors
editYou can test connectors with the run connector API or as you’re creating or editing the connector in Kibana. For example:
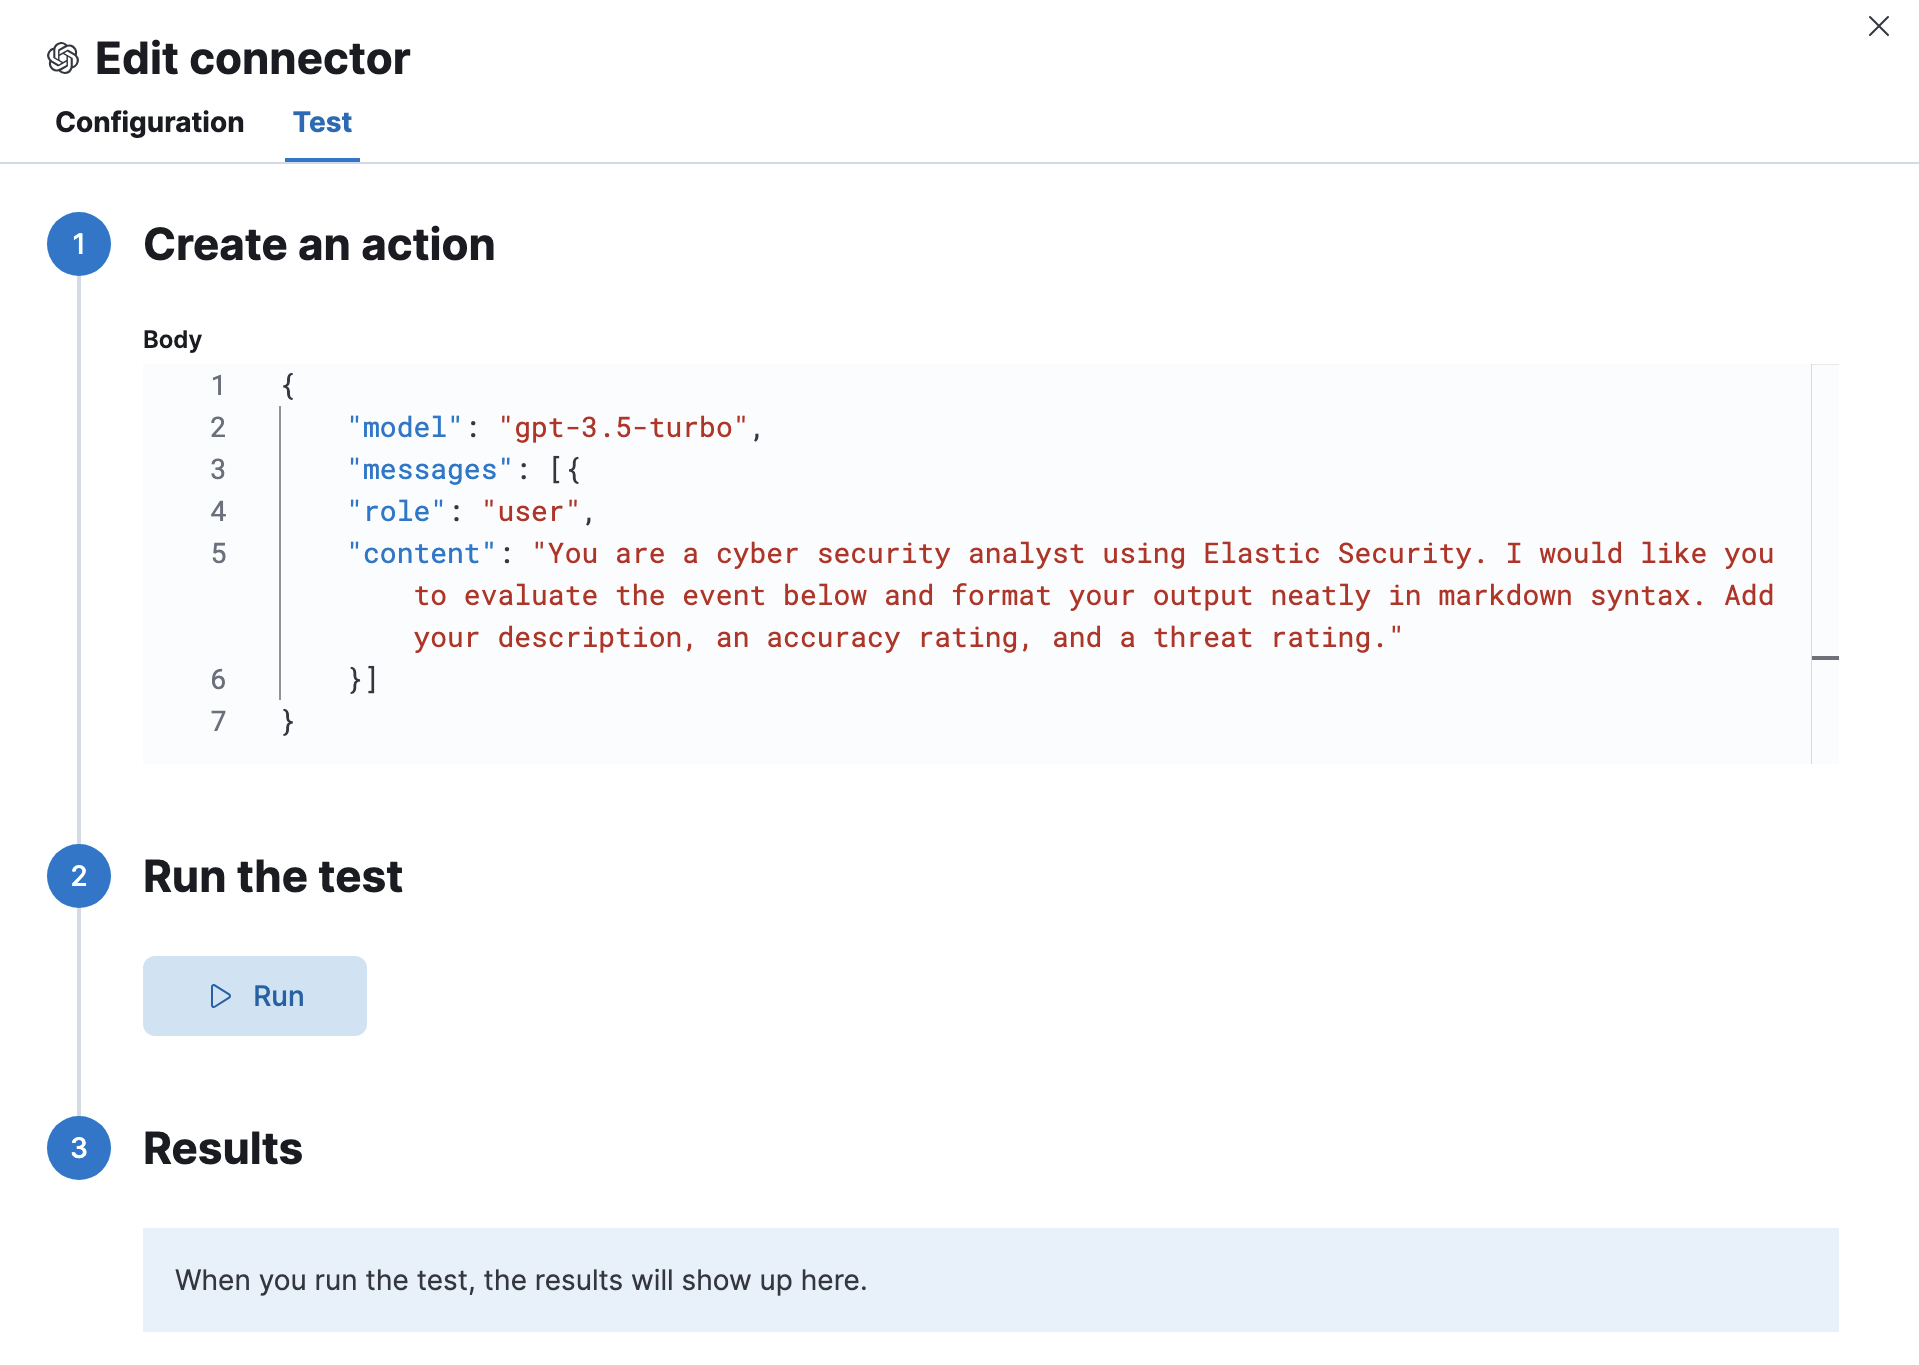
The OpenAI actions have the following configuration properties.
- Body
-
A JSON payload sent to the OpenAI API URL. For example:
{ "model": "gpt-3.5-turbo", "messages": [ { "role": "user", "content": "Hello world" } ] }
Connector networking configuration
editUse the Action configuration settings to customize connector networking configurations, such as proxies, certificates, or TLS settings. You can set configurations that apply to all your connectors or use xpack.actions.customHostSettings
to set per-host configurations.
Token usage dashboard
editOnce you’ve created a OpenAI connector, you can monitor its token usage using the OpenAI Token Usage dashboard. Select the connector in Stack Management > Connectors to view its details, then click the View OpenAI Usage Dashboard for "<Name>" Connector link to open the dashboard.
To view the dashboard, you need at least read
and view_index_metadata
privileges for the .kibana-event-log-*
index and the Read
feature privilege for Kibana. You can set up a role with these minimum privileges and assign it to non-admin users who need to view this dashboard.
On this page