- Kibana Guide: other versions:
- What is Kibana?
- What’s new in 8.13
- Kibana concepts
- Quick start
- Set up
- Install Kibana
- Configure Kibana
- Alerting and action settings
- APM settings
- Banners settings
- Cases settings
- Enterprise Search settings
- Fleet settings
- i18n settings
- Logging settings
- Logs settings
- Metrics settings
- Monitoring settings
- Reporting settings
- Search sessions settings
- Secure settings
- Security settings
- Spaces settings
- Task Manager settings
- Telemetry settings
- URL drilldown settings
- Start and stop Kibana
- Access Kibana
- Securing access to Kibana
- Add data
- Upgrade Kibana
- Configure security
- Configure reporting
- Configure logging
- Configure monitoring
- Command line tools
- Production considerations
- Discover
- Dashboard and visualizations
- Canvas
- Maps
- Build a map to compare metrics by country or region
- Track, visualize, and alert on assets in real time
- Map custom regions with reverse geocoding
- Heat map layer
- Tile layer
- Vector layer
- Plot big data
- Search geographic data
- Configure map settings
- Connect to Elastic Maps Service
- Import geospatial data
- Troubleshoot
- Reporting and sharing
- Machine learning
- Graph
- Alerting
- Observability
- APM
- Set up
- Get started
- How-to guides
- Configure APM agents with central config
- Control access to APM data
- Create an alert
- Create custom links
- Filter data
- Find transaction latency and failure correlations
- Identify deployment details for APM agents
- Integrate with machine learning
- Exploring mobile sessions with Discover
- Viewing sessions with Discover
- Observe Lambda functions
- Query your data
- Storage Explorer
- Track deployments with annotations
- Users and privileges
- Settings
- REST API
- Troubleshooting
- Security
- Dev Tools
- Fleet
- Osquery
- Stack Monitoring
- Stack Management
- REST API
- Get features API
- Kibana spaces APIs
- Kibana role management APIs
- User session management APIs
- Saved objects APIs
- Data views API
- Get all data views
- Get data view
- Create data view
- Update data view
- Delete data view
- Swap references preview
- Swap references
- Get default data view
- Set default data view
- Update data view fields metadata
- Get runtime field
- Create runtime field
- Upsert runtime field
- Update runtime field
- Delete runtime field
- Index patterns APIs
- Alerting APIs
- Action and connector APIs
- Cases APIs
- Add comment
- Create case
- Delete cases
- Delete comments
- Find case activity
- Find cases
- Find connectors
- Get alerts
- Get case activity
- Get case
- Get case status
- Get cases by alert
- Get comments
- Get configuration
- Get reporters
- Get tags
- Push case
- Set configuration
- Update cases
- Update comment
- Update configuration
- Import and export dashboard APIs
- Logstash configuration management APIs
- Machine learning APIs
- Osquery manager API
- Short URLs APIs
- Get Task Manager health
- Upgrade assistant APIs
- Synthetics APIs
- Uptime APIs
- Kibana plugins
- Troubleshooting
- Accessibility
- Release notes
- Kibana 8.13.4
- Kibana 8.13.3
- Kibana 8.13.2
- Kibana 8.13.1
- Kibana 8.13.0
- Kibana 8.12.2
- Kibana 8.12.1
- Kibana 8.12.0
- Kibana 8.11.4
- Kibana 8.11.3
- Kibana 8.11.2
- Kibana 8.11.1
- Kibana 8.11.0
- Kibana 8.10.4
- Kibana 8.10.3
- Kibana 8.10.2
- Kibana 8.10.1
- Kibana 8.10.0
- Kibana 8.9.2
- Kibana 8.9.1
- Kibana 8.9.0
- Kibana 8.8.2
- Kibana 8.8.1
- Kibana 8.8.0
- Kibana 8.7.1
- Kibana 8.7.0
- Kibana 8.6.1
- Kibana 8.6.0
- Kibana 8.5.2
- Kibana 8.5.1
- Kibana 8.5.0
- Kibana 8.4.3
- Kibana 8.4.2
- Kibana 8.4.1
- Kibana 8.4.0
- Kibana 8.3.3
- Kibana 8.3.2
- Kibana 8.3.1
- Kibana 8.3.0
- Kibana 8.2.3
- Kibana 8.2.2
- Kibana 8.2.1
- Kibana 8.2.0
- Kibana 8.1.3
- Kibana 8.1.2
- Kibana 8.1.1
- Kibana 8.1.0
- Kibana 8.0.0
- Kibana 8.0.0-rc2
- Kibana 8.0.0-rc1
- Kibana 8.0.0-beta1
- Kibana 8.0.0-alpha2
- Kibana 8.0.0-alpha1
- Developer guide
Maintenance windows
editMaintenance windows
editThis functionality is in technical preview and may be changed or removed in a future release. Elastic will work to fix any issues, but features in technical preview are not subject to the support SLA of official GA features.
You can schedule single or recurring maintenance windows to temporarily reduce rule notifications. For example, a maintenance window prevents false alarms during planned outages.
By default, a maintenance window affects all rules in all Kibana apps within its space. You can refine the scope of a maintenance window by adding filters and rule categories.
Alerts continue to be generated, however notifications are suppressed as follows:
- When an alert occurs during a maintenance window, there are no notifications. When the alert recovers, there are no notifications—even if the recovery occurs after the maintenance window ends.
- When an alert occurs before a maintenance window and recovers during or after the maintenance window, notifications are sent as usual.
Configure access to maintenance windows
editTo use maintenance windows, you must have the appropriate subscription and Kibana feature privileges.
-
To have full access to maintenance windows, you must have
All
privileges for the Management > Maintenance Windows feature. -
To have view-only access to maintenance windows, you must have
Read
privileges for the Management > Maintenance Windows feature.
For more details, refer to Kibana privileges.
Create and manange maintenance windows
editIn Management > Stack Management > Maintenance Windows, you can create, edit, and archive maintenance windows.
When you create a maintenance window, you must provide a name and a schedule. You can optionally configure it to repeat daily, monthly, yearly, or on a custom interval.
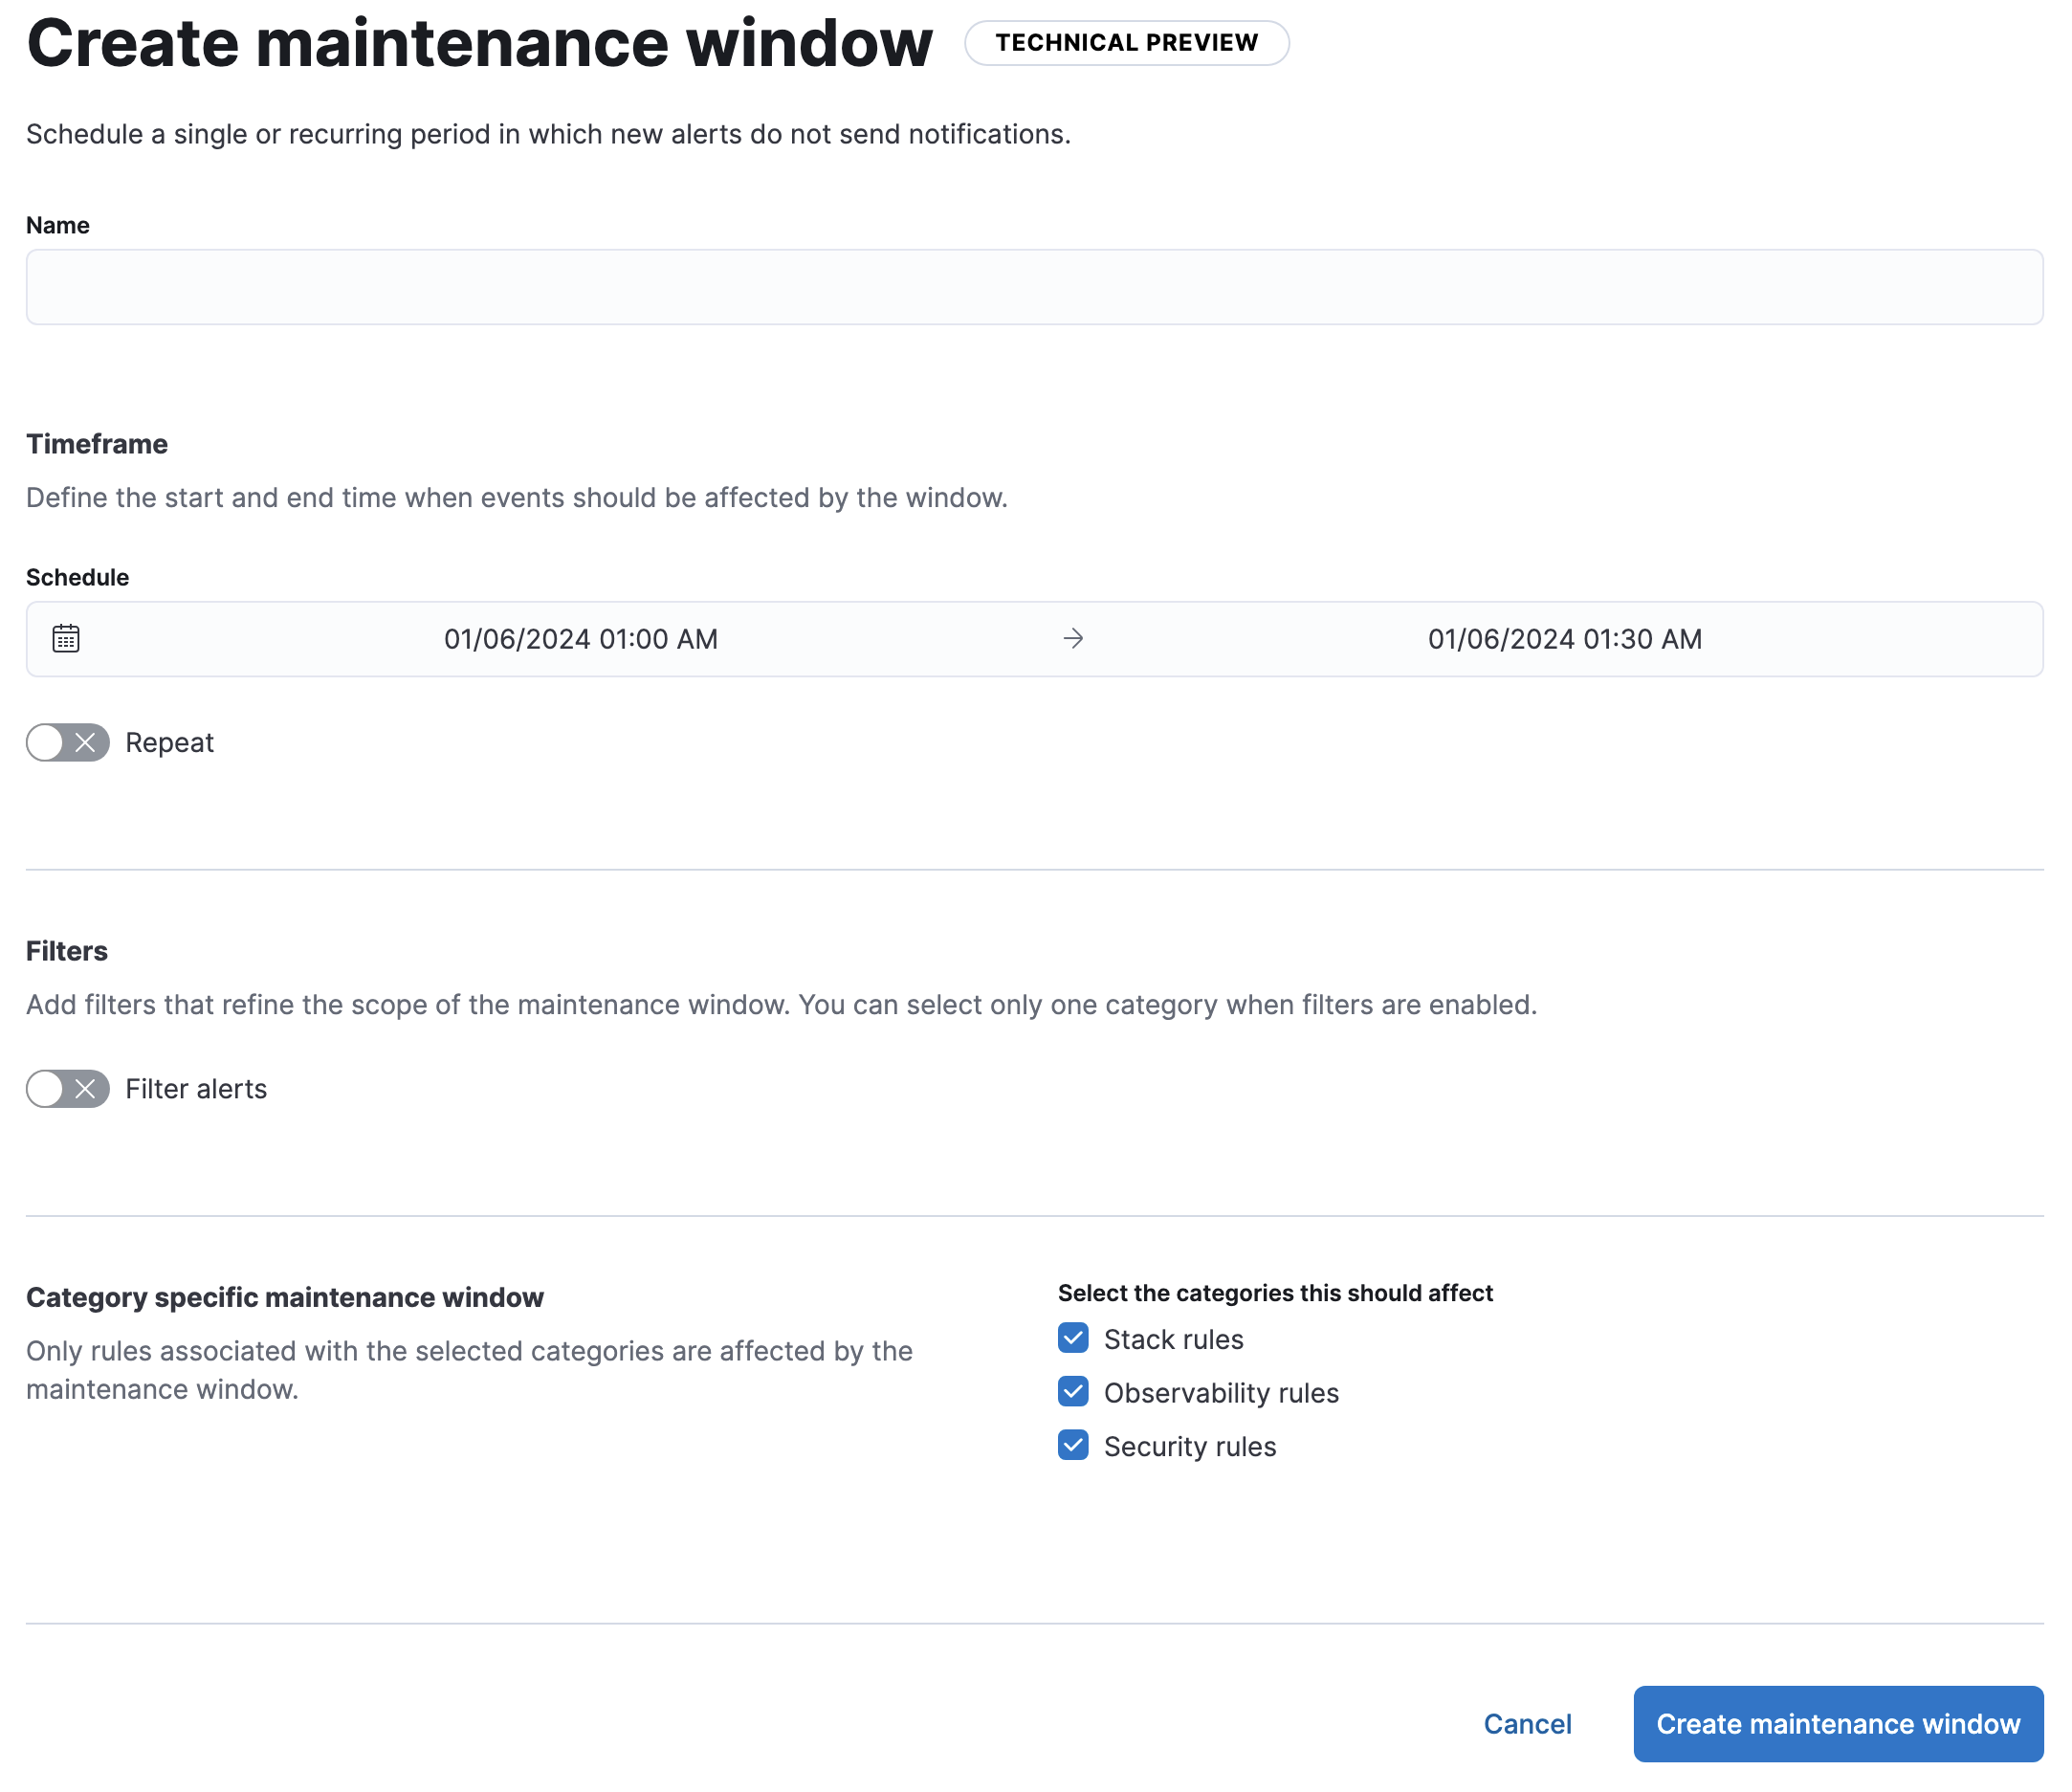
By default, maintenance windows affect all categories of rules. The category-specific maintenance window options alter this behavior. For the definitive list of rule types in each category, refer to the get rule types API.
If you turn on Filter alerts, you can use KQL to filter the alerts affected by the maintenance window:
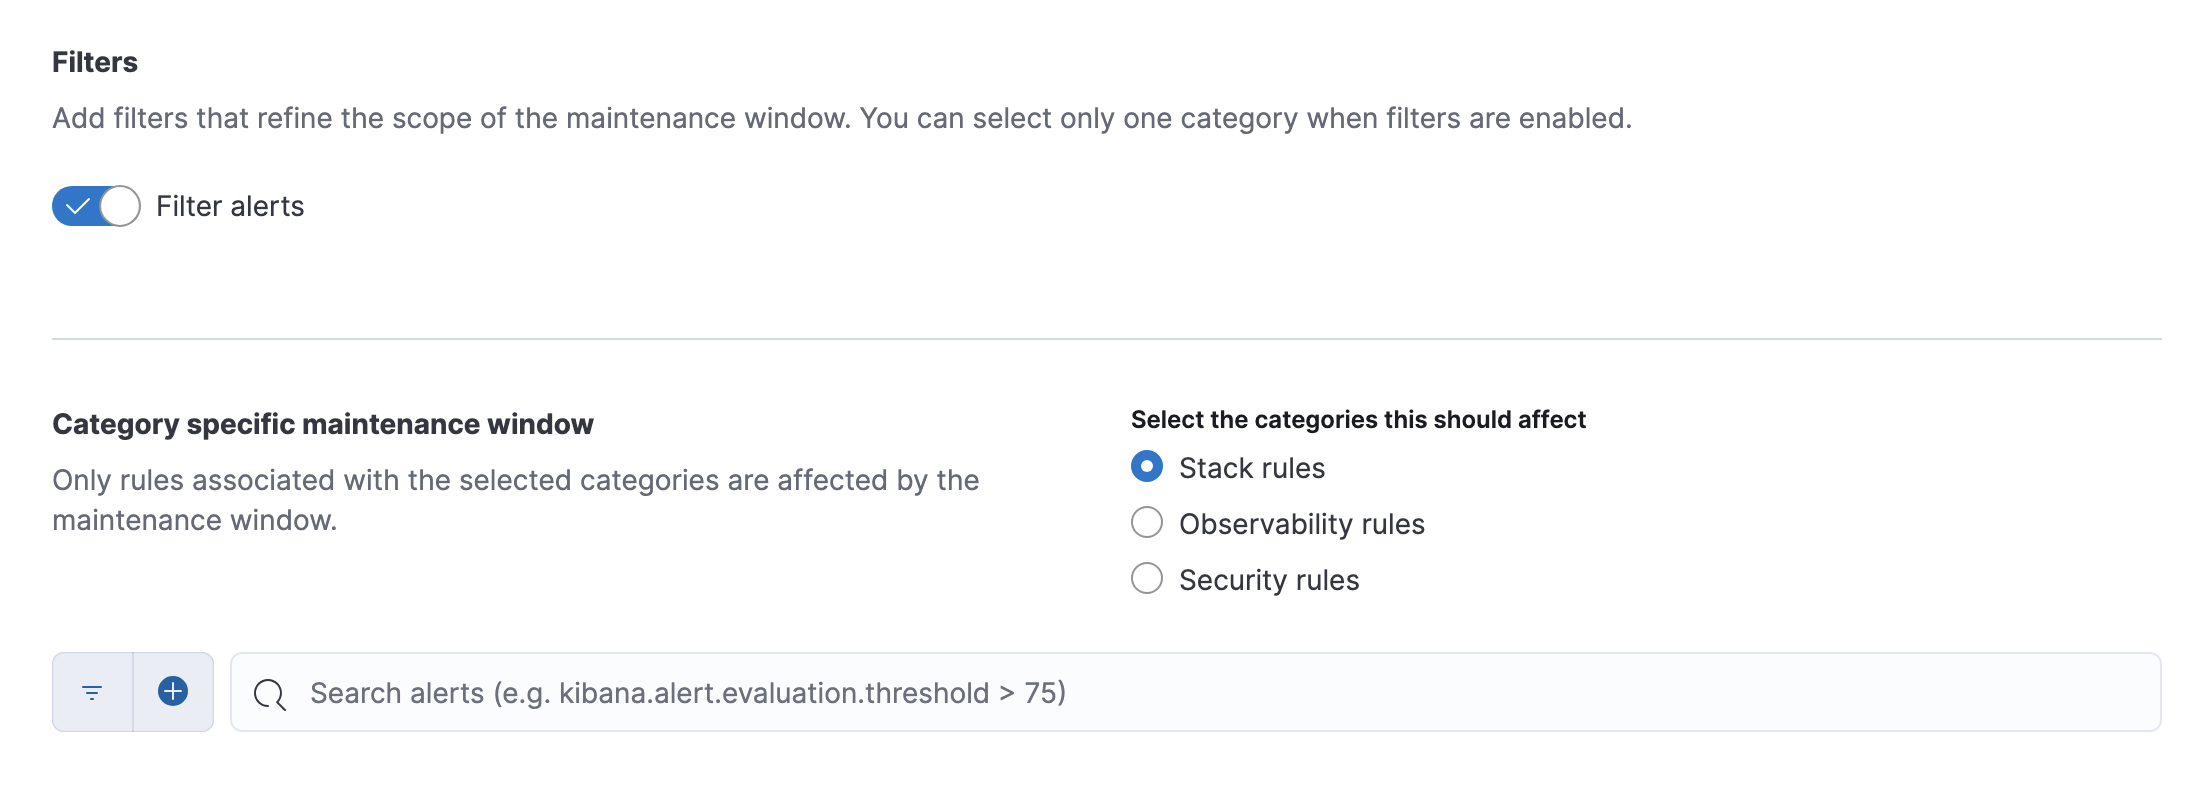
You can select only a single category when you turn on filters.
A maintenance window can have any one of the following statuses:
-
Upcoming
: It will run at the scheduled date and time. -
Running
: It is running. -
Finished
: It ended and does not have a repeat schedule. -
Archived
: It is archived. In a future release, archived maintenance windows will be queued for deletion.
When you view alert details in Kibana, each alert shows unique identifiers for maintenance windows that affected it.