Create a data view
editCreate a data view
editKibana requires a data view to access the Elasticsearch data that you want to explore. A data view can point to one or more indices, data streams, or index aliases. For example, a data view can point to your log data from yesterday, or all indices that contain your data.
Required permissions
edit-
Access to Data Views requires the Kibana privilege
Data View Management. -
To create a data view, you must have the Elasticsearch privilege
view_index_metadata. - If a read-only indicator appears in Kibana, you have insufficient privileges to create or save data views. In addition, the buttons to create data views or save existing data views are not visible. For more information, refer to Granting access to Kibana.
Create a data view
editIf you collected data using one of the Kibana ingest options, uploaded a file, or added sample data, you get a data view for free, and can start exploring your data. If you loaded your own data, follow these steps to create a data view.
-
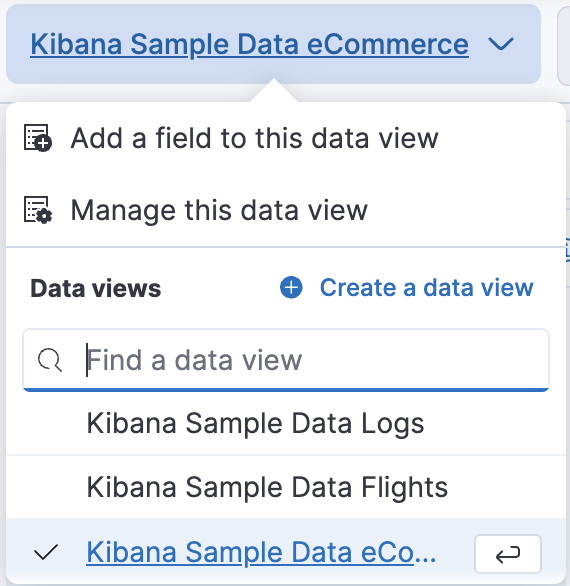
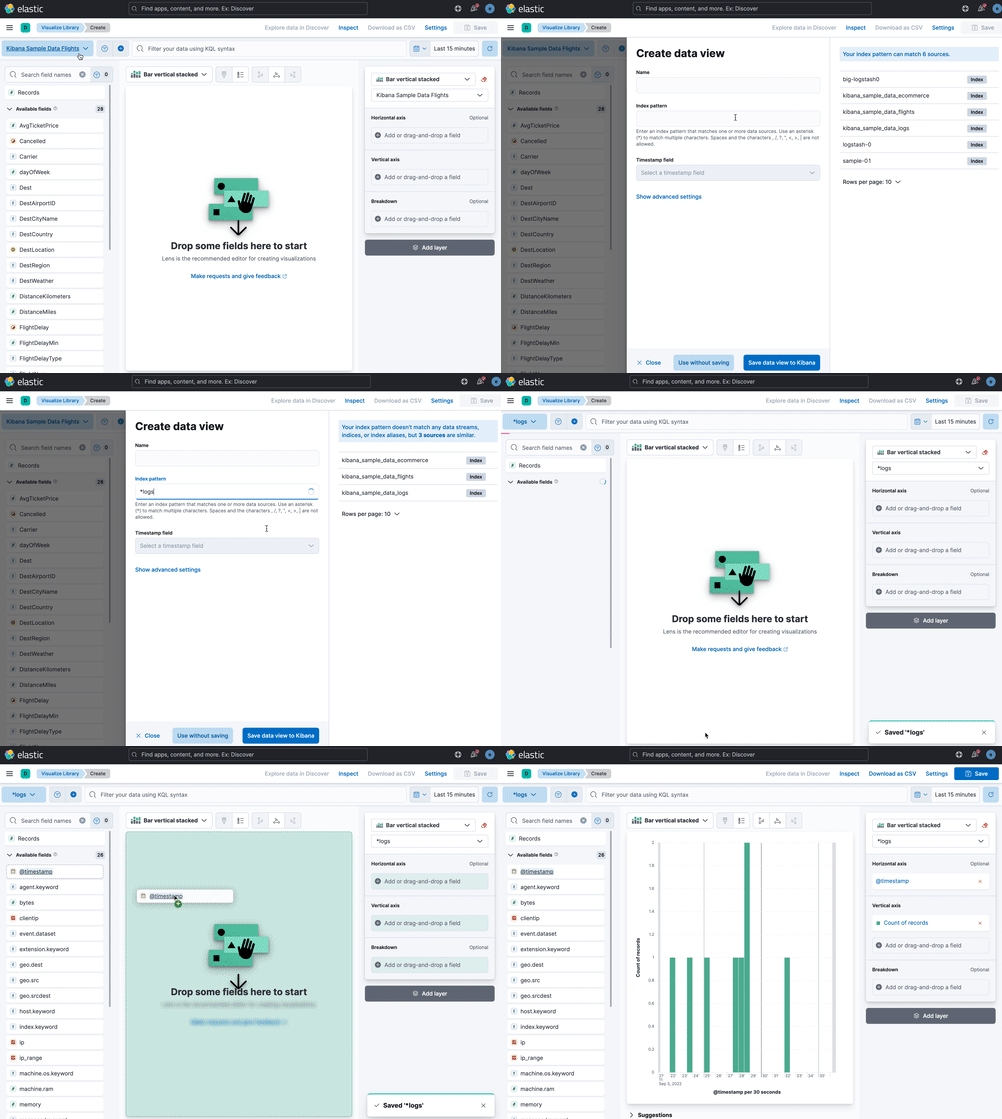
Open Lens or Discover, and then open the data view menu.

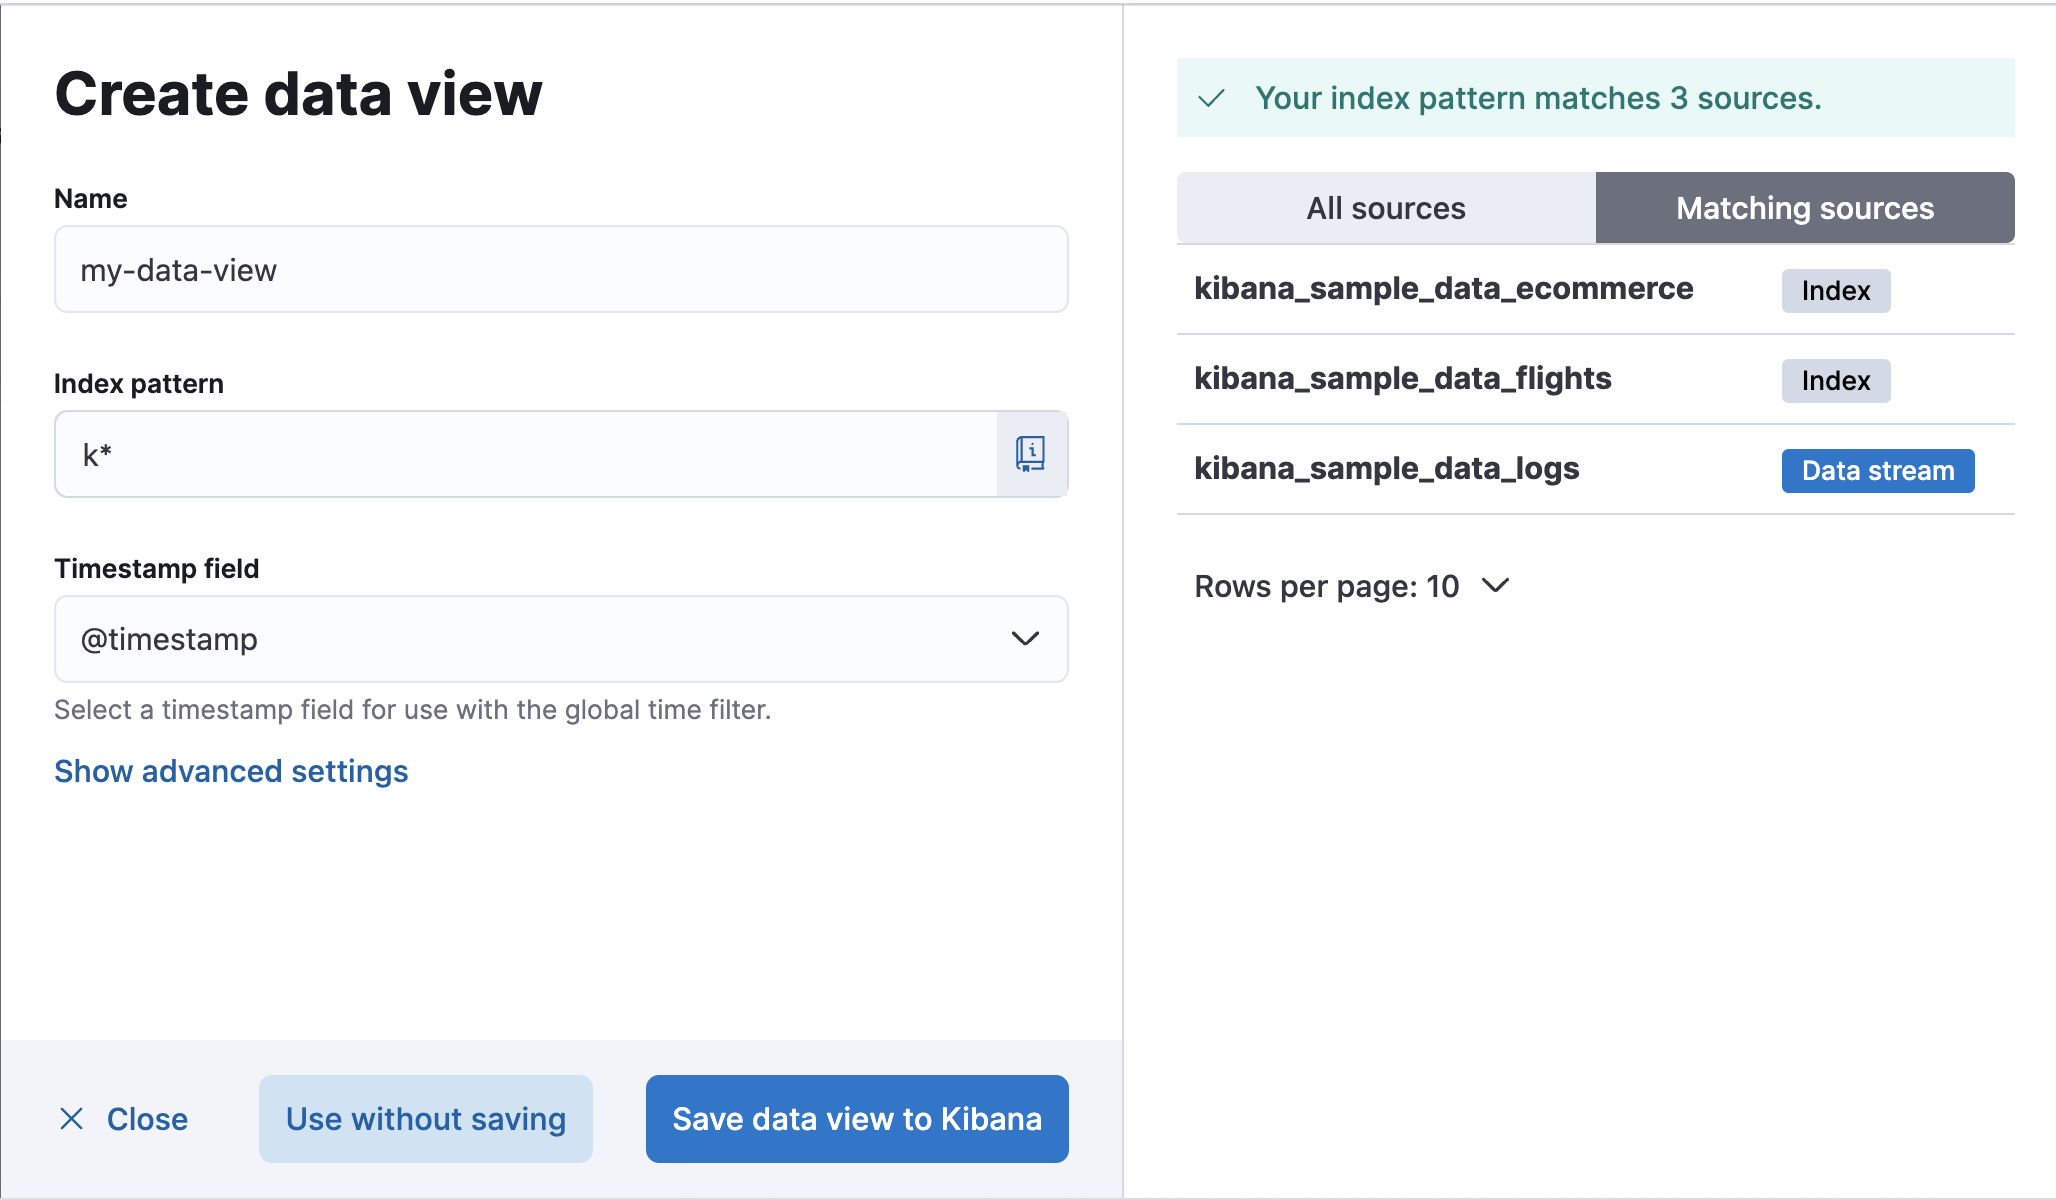
- Click Create a data view.
- Give your data view a name.
-
Start typing in the Index pattern field, and Kibana looks for the names of indices, data streams, and aliases that match your input. You can view all available sources or only the sources that the data view targets.

-
To match multiple sources, use a wildcard (*).
filebeat-*matchesfilebeat-apache-a,filebeat-apache-b, and so on. -
To match multiple single sources, enter their names,
separated by a comma. Do not include a space after the comma.
filebeat-a,filebeat-bmatches two indices. -
To exclude a source, use a minus sign (-), for example,
-test3.
-
To match multiple sources, use a wildcard (*).
-
Open the Timestamp field dropdown, and then select the default field for filtering your data by time.
- If you don’t set a default time field, you can’t use global time filters on your dashboards. This is useful if you have multiple time fields and want to create dashboards that combine visualizations based on different timestamps.
- If your index doesn’t have time-based data, choose I don’t want to use the time filter.
-
Click Show advanced settings to:
- Display hidden and system indices.
- Specify your own data view name. For example, enter your Elasticsearch index alias name.
-
Click Save data view to Kibana.
You can manage your data view from Stack Management.
Create a temporary data view
editWant to explore your data or create a visualization without saving it as a data view? Select Use without saving in the Create data view form in Discover or Lens. With a temporary data view, you can add fields and create an Elasticsearch query alert, just like you would a regular data view. Your work won’t be visible to others in your space.
A temporary data view remains in your space until you change apps, or until you save it.

Temporary data views are not available in Stack Management.
Use data views with rolled up data
editDeprecated in 8.11.0.
Rollups are deprecated and will be removed in a future version. Use downsampling instead.
A data view can match one rollup index. For a combination rollup data view with both raw and rolled up data, use the standard notation:
rollup_logstash,kibana_sample_data_logs
For an example, refer to Create and visualize rolled up data.
Use data views with cross-cluster search
editIf your Elasticsearch clusters are configured for cross-cluster search, you can create a data view to search across the clusters of your choosing. Specify data streams, indices, and aliases in a remote cluster using the following syntax:
<remote_cluster_name>:<target>
To query Logstash indices across two Elasticsearch clusters
that you set up for cross-cluster search, named cluster_one and cluster_two:
cluster_one:logstash-*,cluster_two:logstash-*
Use wildcards in your cluster names
to match any number of clusters. To search Logstash indices across
clusters named cluster_foo, cluster_bar, and so on:
cluster_*:logstash-*
To query across all Elasticsearch clusters that have been configured for cross-cluster search, use a standalone wildcard for your cluster name:
*:logstash-*
To match indices starting with logstash-, but exclude those starting with logstash-old, from
all clusters having a name starting with cluster_:
`cluster_*:logstash-*,cluster_*:-logstash-old*`
Excluding a cluster avoids sending any network calls to that cluster.
To exclude a cluster with the name cluster_one:
`cluster_*:logstash-*,-cluster_one:*`
Once you configure a data view to use the cross-cluster search syntax, all searches and aggregations using that data view in Kibana take advantage of cross-cluster search.
For more information, refer to Excluding clusters or indicies from cross-cluster search.
Delete a data view
editWhen you delete a data view, you cannot recover the associated field formatters, runtime fields, source filters, and field popularity data. Deleting a data view does not remove any indices or data documents from Elasticsearch.
Deleting a data view breaks all visualizations, saved searches, and other saved objects that reference the data view.
- Open the main menu, and then click Stack Management > Data Views.
-
Find the data view that you want to delete, and then
click
 in the Actions column.
data view field cache
editThe browser caches data view field lists for increased performance. This is particularly impactful for data views with a high field count that span a large number of indices and clusters. The field list is updated every couple of minutes in typical Kibana usage. Alternatively, use the refresh button on the data view management detail page to get an updated field list. A force reload of Kibana has the same effect.
The field list may be impacted by changes in indices and user permissions.