- Kibana Guide: other versions:
- What is Kibana?
- What’s new in 8.13
- Kibana concepts
- Quick start
- Set up
- Install Kibana
- Configure Kibana
- Alerting and action settings
- APM settings
- Banners settings
- Cases settings
- Enterprise Search settings
- Fleet settings
- i18n settings
- Logging settings
- Logs settings
- Metrics settings
- Monitoring settings
- Reporting settings
- Search sessions settings
- Secure settings
- Security settings
- Spaces settings
- Task Manager settings
- Telemetry settings
- URL drilldown settings
- Start and stop Kibana
- Access Kibana
- Securing access to Kibana
- Add data
- Upgrade Kibana
- Configure security
- Configure reporting
- Configure logging
- Configure monitoring
- Command line tools
- Production considerations
- Discover
- Dashboard and visualizations
- Canvas
- Maps
- Build a map to compare metrics by country or region
- Track, visualize, and alert on assets in real time
- Map custom regions with reverse geocoding
- Heat map layer
- Tile layer
- Vector layer
- Plot big data
- Search geographic data
- Configure map settings
- Connect to Elastic Maps Service
- Import geospatial data
- Troubleshoot
- Reporting and sharing
- Machine learning
- Graph
- Alerting
- Observability
- APM
- Set up
- Get started
- How-to guides
- Configure APM agents with central config
- Control access to APM data
- Create an alert
- Create custom links
- Filter data
- Find transaction latency and failure correlations
- Identify deployment details for APM agents
- Integrate with machine learning
- Exploring mobile sessions with Discover
- Viewing sessions with Discover
- Observe Lambda functions
- Query your data
- Storage Explorer
- Track deployments with annotations
- Users and privileges
- Settings
- REST API
- Troubleshooting
- Security
- Dev Tools
- Fleet
- Osquery
- Stack Monitoring
- Stack Management
- REST API
- Get features API
- Kibana spaces APIs
- Kibana role management APIs
- User session management APIs
- Saved objects APIs
- Data views API
- Get all data views
- Get data view
- Create data view
- Update data view
- Delete data view
- Swap references preview
- Swap references
- Get default data view
- Set default data view
- Update data view fields metadata
- Get runtime field
- Create runtime field
- Upsert runtime field
- Update runtime field
- Delete runtime field
- Index patterns APIs
- Alerting APIs
- Action and connector APIs
- Cases APIs
- Add comment
- Create case
- Delete cases
- Delete comments
- Find case activity
- Find cases
- Find connectors
- Get alerts
- Get case activity
- Get case
- Get case status
- Get cases by alert
- Get comments
- Get configuration
- Get reporters
- Get tags
- Push case
- Set configuration
- Update cases
- Update comment
- Update configuration
- Import and export dashboard APIs
- Logstash configuration management APIs
- Machine learning APIs
- Osquery manager API
- Short URLs APIs
- Get Task Manager health
- Upgrade assistant APIs
- Synthetics APIs
- Uptime APIs
- Kibana plugins
- Troubleshooting
- Accessibility
- Release notes
- Kibana 8.13.4
- Kibana 8.13.3
- Kibana 8.13.2
- Kibana 8.13.1
- Kibana 8.13.0
- Kibana 8.12.2
- Kibana 8.12.1
- Kibana 8.12.0
- Kibana 8.11.4
- Kibana 8.11.3
- Kibana 8.11.2
- Kibana 8.11.1
- Kibana 8.11.0
- Kibana 8.10.4
- Kibana 8.10.3
- Kibana 8.10.2
- Kibana 8.10.1
- Kibana 8.10.0
- Kibana 8.9.2
- Kibana 8.9.1
- Kibana 8.9.0
- Kibana 8.8.2
- Kibana 8.8.1
- Kibana 8.8.0
- Kibana 8.7.1
- Kibana 8.7.0
- Kibana 8.6.1
- Kibana 8.6.0
- Kibana 8.5.2
- Kibana 8.5.1
- Kibana 8.5.0
- Kibana 8.4.3
- Kibana 8.4.2
- Kibana 8.4.1
- Kibana 8.4.0
- Kibana 8.3.3
- Kibana 8.3.2
- Kibana 8.3.1
- Kibana 8.3.0
- Kibana 8.2.3
- Kibana 8.2.2
- Kibana 8.2.1
- Kibana 8.2.0
- Kibana 8.1.3
- Kibana 8.1.2
- Kibana 8.1.1
- Kibana 8.1.0
- Kibana 8.0.0
- Kibana 8.0.0-rc2
- Kibana 8.0.0-rc1
- Kibana 8.0.0-beta1
- Kibana 8.0.0-alpha2
- Kibana 8.0.0-alpha1
- Developer guide
Change your expression, change your output
editChange your expression, change your output
editYou can substitute one function for another to change the output. For example, you could change the visualization by swapping out the pie function for another renderer, a function that returns a render
data type.
Let’s change that last pie chart into a bubble chart by replacing the pie function with the plot function. This is possible because both functions can accept a pointseries
data type as their context. Switching the functions will work, but it won’t produce a useful visualization on its own since you don’t have the x-axis and y-axis defined. You will also need to modify the pointseries function to change its output. In this case, you can change the size
argument to y
, so the maximum price values are plotted on the y-axis, and add an x
argument using the @timestamp
field in the data to plot those values over time. This leaves you with the following expression and produces a bubble chart showing the max price of each state over time:
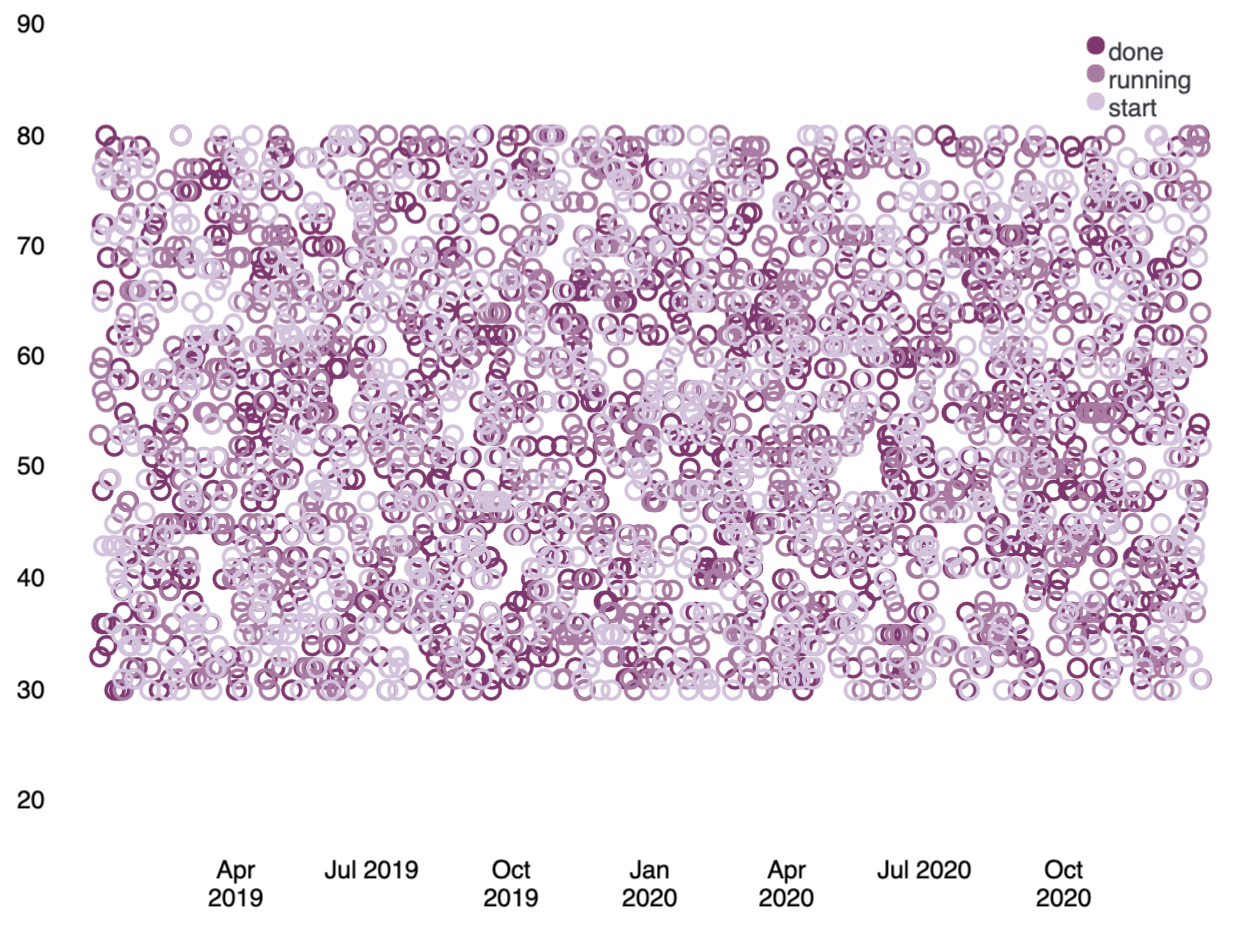
filters | demodata | pointseries color="state" y="max(price)" x="@timestamp" | plot | render
Similar to the pie function, the plot function takes arguments that control the design elements of the visualization. As one example, passing a legend
argument with a value of false
to the function will hide the legend on the chart.
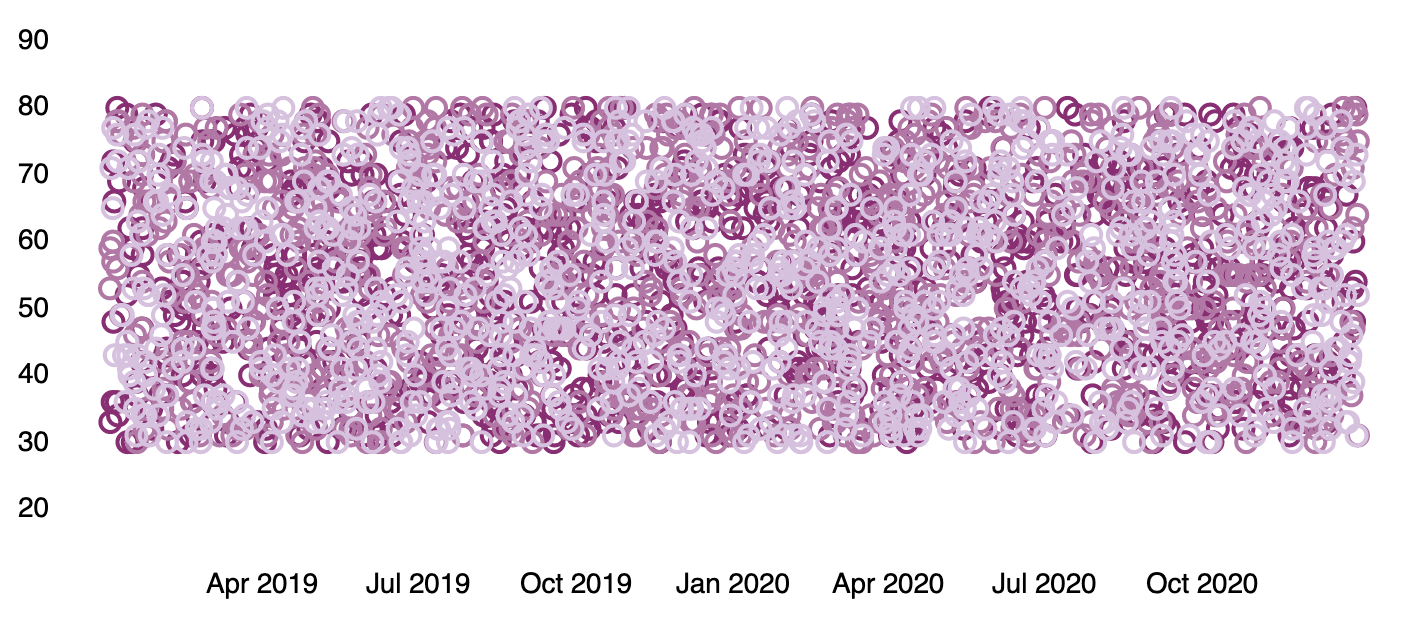
filters | demodata | pointseries color="state" y="max(price)" x="@timestamp" | plot legend=false | render