- Kibana Guide: other versions:
- What is Kibana?
- What’s new in 7.11
- Quick start
- Set up
- Discover
- Dashboard
- Canvas
- Maps
- Machine learning
- Graph
- Observability
- APM
- Elastic Security
- Dev Tools
- Stack Monitoring
- Stack Management
- Fleet
- Reporting
- Alerting and Actions
- REST API
- Kibana plugins
- Accessibility
- Breaking Changes
- Release notes
- Kibana 7.11.2
- Kibana 7.11.1
- Kibana 7.11.0
- Kibana 7.10.2
- Kibana 7.10.1
- Kibana 7.10.0
- Kibana 7.9.3
- Kibana 7.9.2
- Kibana 7.9.1
- Kibana 7.9.0
- Kibana 7.8.1
- Kibana 7.8.0
- Kibana 7.7.1
- Kibana 7.7.0
- Kibana 7.6.2
- Kibana 7.6.1
- Kibana 7.6.0
- Kibana 7.5.2
- Kibana 7.5.1
- Kibana 7.5.0
- Kibana 7.4.2
- Kibana 7.4.1
- Kibana 7.4.0
- Kibana 7.3.2
- Kibana 7.3.1
- Kibana 7.3.0
- Kibana 7.2.1
- Kibana 7.2.0
- Kibana 7.1.1
- Kibana 7.1.0
- Kibana 7.0.1
- Kibana 7.0.0
- Kibana 7.0.0-rc2
- Kibana 7.0.0-rc1
- Kibana 7.0.0-beta1
- Kibana 7.0.0-alpha2
- Kibana 7.0.0-alpha1
- Developer guide
IMPORTANT: No additional bug fixes or documentation updates
will be released for this version. For the latest information, see the
current release documentation.
Logstash Monitoring Metrics
editLogstash Monitoring Metrics
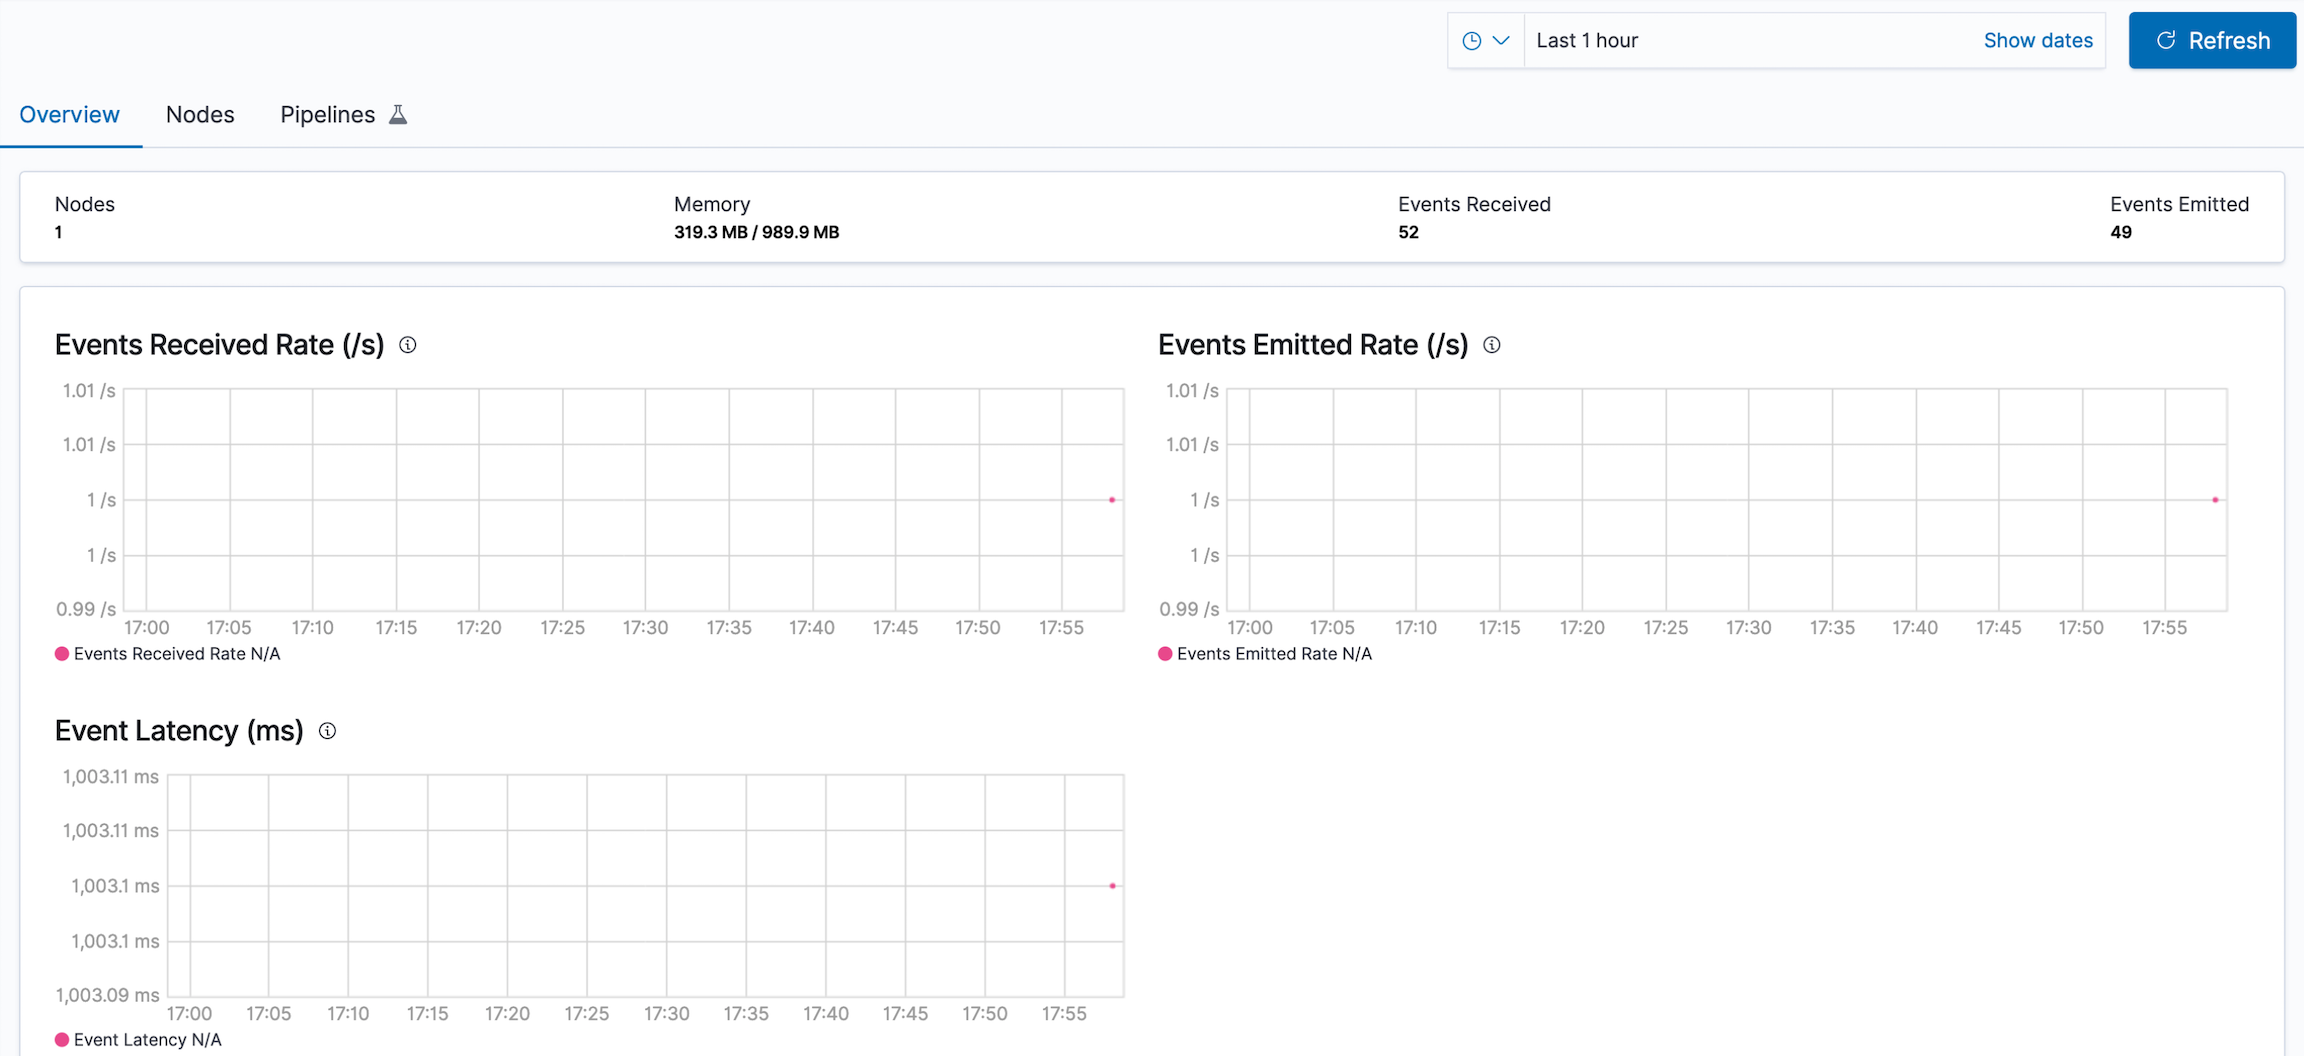
editIf you are monitoring Logstash nodes, click Overview in the Logstash section of the Stack Monitoring page in Kibana. You can view the overall health of the Logstash nodes.
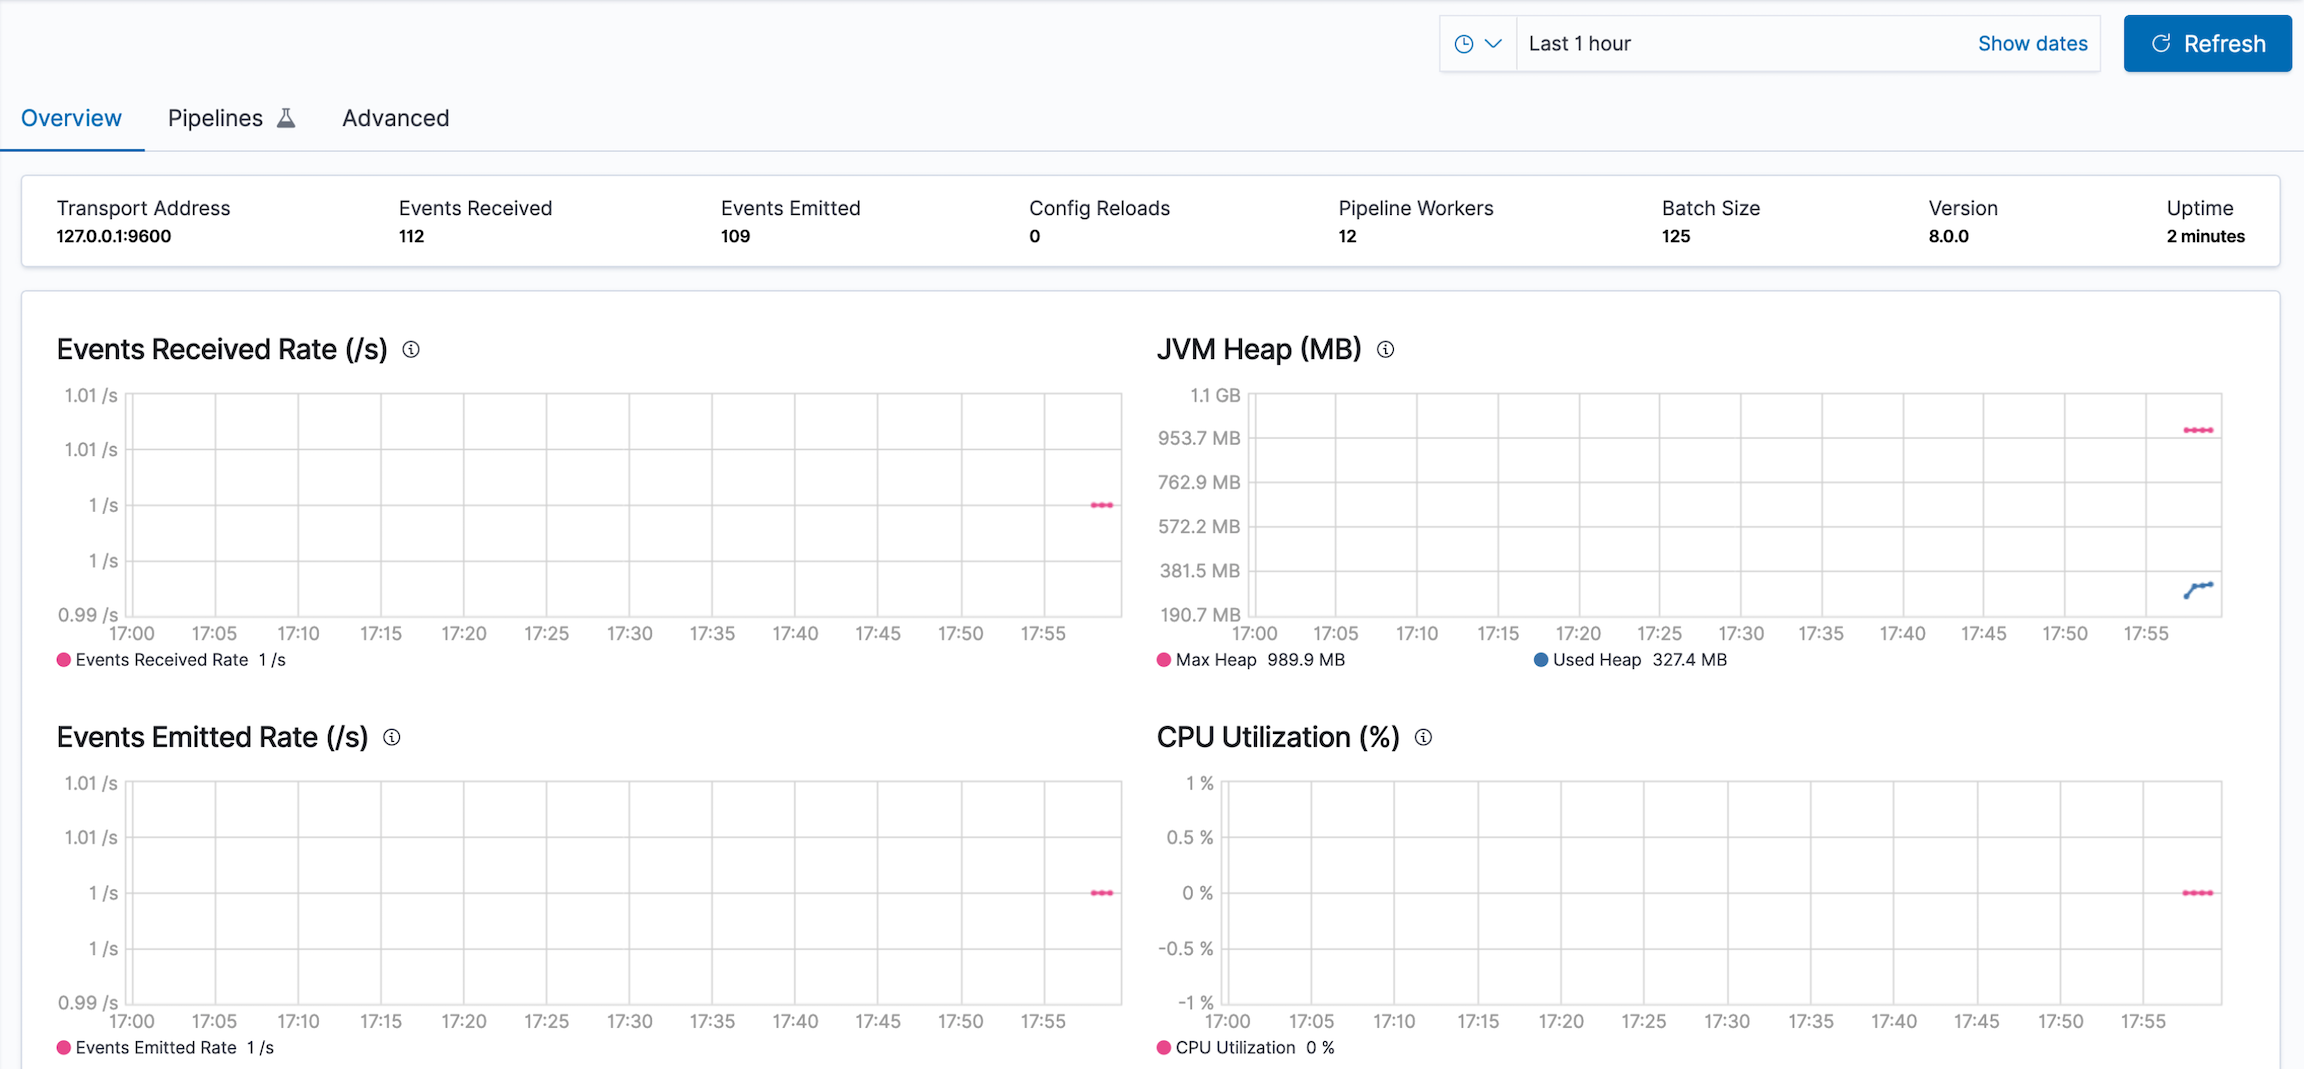
To view Logstash node metrics, click Nodes. The Nodes section shows the status of each Logstash node.
Click the name of a node to view its statistics over time.
For more information, see Monitoring Logstash.
Was this helpful?
Thank you for your feedback.