IMPORTANT: No additional bug fixes or documentation updates
will be released for this version. For the latest information, see the
current release documentation.
Vector layer
edit
IMPORTANT: This documentation is no longer updated. Refer to Elastic's version policy and the latest documentation.
Vector layer
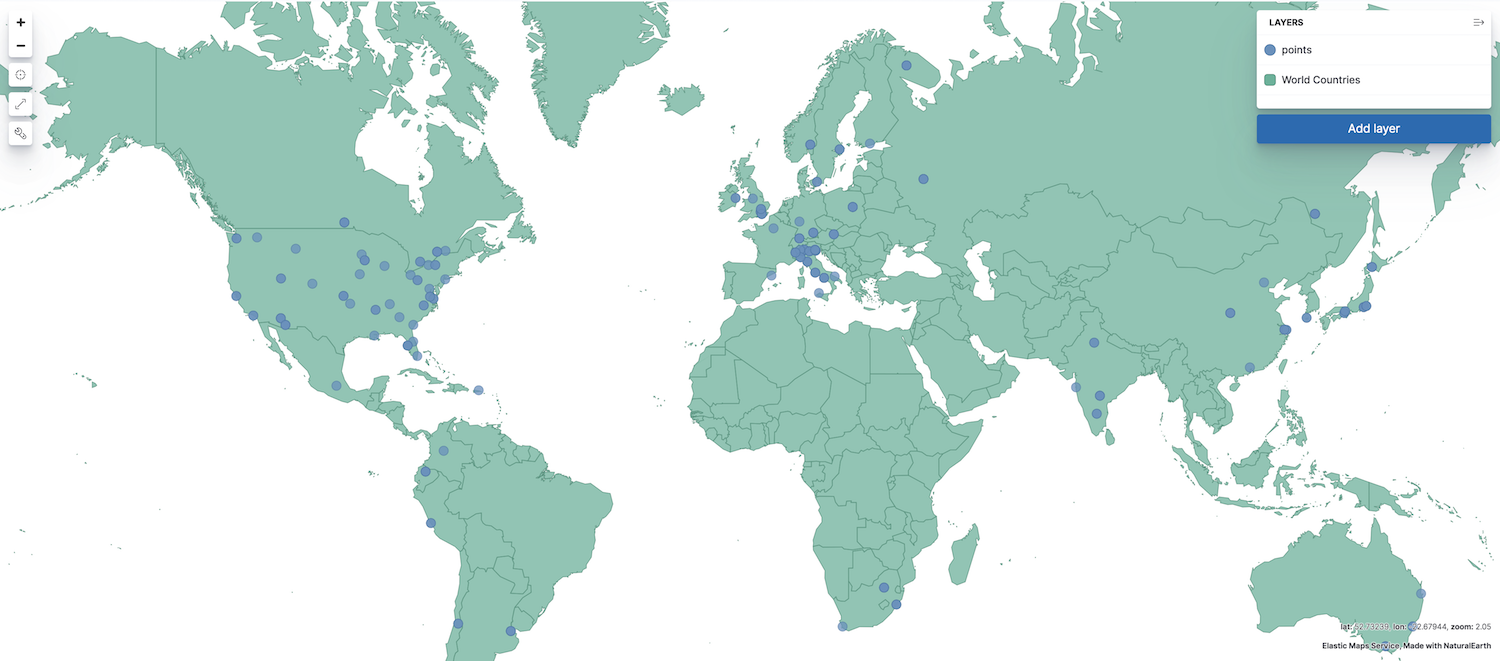
editVector layers display points, lines, and polygons.
To add a vector layer to your map, click Add layer, then select one of the following:
- Choropleth
- Shaded areas to compare statistics across boundaries.
- Clusters and grids
- Geospatial data grouped in grids with metrics for each gridded cell. The index must contain at least one field mapped as geo_point or geo_shape.
- Documents
-
Points, lines, and polyons from Elasticsearch. The index must contain at least one field mapped as geo_point or geo_shape.
Results are limited to the
index.max_result_windowindex setting, which defaults to 10000. Select the appropriate Scaling option for your use case.-
Limit results to 10000. The layer displays features from the first
index.max_result_windowdocuments. Results exceedingindex.max_result_windoware not displayed. - Show top hits per entity. The layer displays the most relevant documents per entity.
-
Show clusters when results exceed 10000. When results exceed
index.max_result_window, the layer uses GeoTile grid aggregation to group your documents into clusters and displays metrics for each cluster. When results are less thenindex.max_result_window, the layer displays features from individual documents. -
Use vector tiles. Vector tiles partition your map into 6 to 8 tiles.
Each tile request is limited to the
index.max_result_windowindex setting. Tiles exceedingindex.max_result_windowhave a visual indicator when there are too many features to display.
-
Limit results to 10000. The layer displays features from the first
- EMS Boundaries
- Administrative boundaries from Elastic Maps Service.
- Point to point
- Aggregated data paths between the source and destination. The index must contain at least 2 fields mapped as geo_point, source and destination.
- Upload Geojson
- Index GeoJSON data in Elasticsearch.