- Kibana Guide: other versions:
- What is Kibana?
- What’s new in 7.10
- Quick start
- Set up
- Discover
- Dashboard
- Edit dashboards
- Explore dashboard data
- Create custom dashboard actions
- Share dashboards
- Tutorials
- Compare sales over time with Lens
- Create your first visualization with Vega-Lite
- Update Kibana filters from Vega
- Create time series visualizations with Timelion
- Timelion tutorial: Create visualizations with mathematical functions
- Create visualizations with conditional logic and tracking trends using Timelion
- Aggregation reference
- Vega reference
- Canvas
- Maps
- Machine learning
- Graph
- Observability
- APM
- Elastic Security
- Dev Tools
- Stack Monitoring
- Stack Management
- Fleet
- Reporting
- Alerting and Actions
- REST API
- Kibana plugins
- Accessibility
- Breaking Changes
- Release Notes
- Kibana 7.10.2
- Kibana 7.10.1
- Kibana 7.10.0
- Kibana 7.9.3
- Kibana 7.9.2
- Kibana 7.9.1
- Kibana 7.9.0
- Kibana 7.8.1
- Kibana 7.8.0
- Kibana 7.7.1
- Kibana 7.7.0
- Kibana 7.6.2
- Kibana 7.6.1
- Kibana 7.6.0
- Kibana 7.5.2
- Kibana 7.5.1
- Kibana 7.5.0
- Kibana 7.4.2
- Kibana 7.4.1
- Kibana 7.4.0
- Kibana 7.3.2
- Kibana 7.3.1
- Kibana 7.3.0
- Kibana 7.2.1
- Kibana 7.2.0
- Kibana 7.1.1
- Kibana 7.1.0
- Kibana 7.0.1
- Kibana 7.0.0
- Kibana 7.0.0-rc2
- Kibana 7.0.0-rc1
- Kibana 7.0.0-beta1
- Kibana 7.0.0-alpha2
- Kibana 7.0.0-alpha1
- Developer guide
Explore dashboard data
editExplore dashboard data
editTo get a closer look at your data, inspect data elements and explore the underlying data in Discover.
Inspect elements
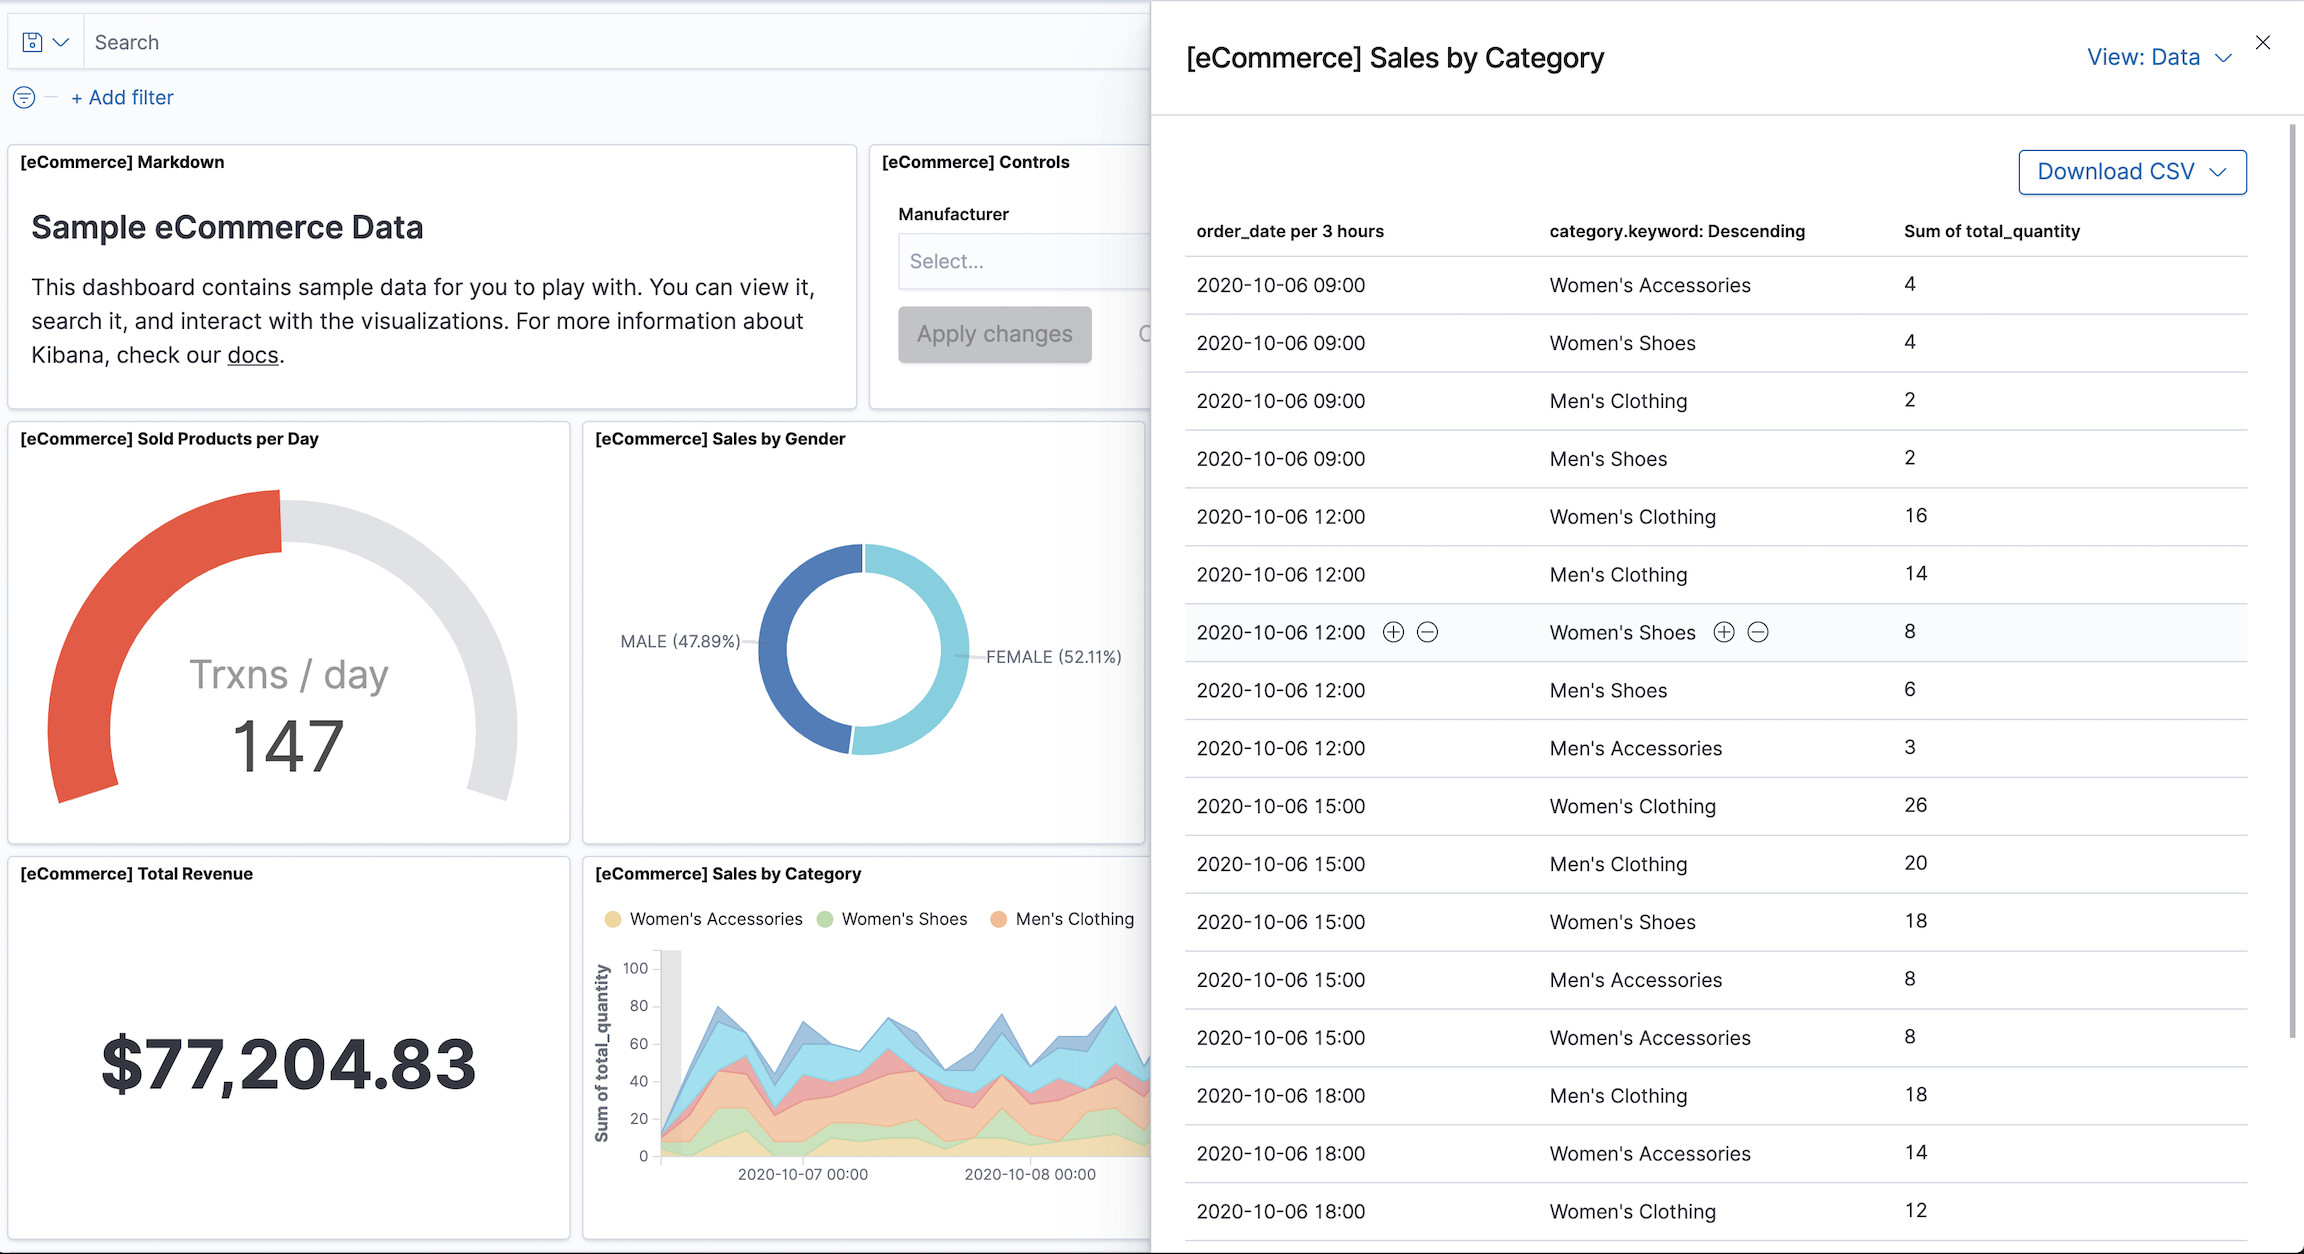
editTo view the data and requests behind the visualizations and saved searches, you can drill down into the elements.
From the panel menu, select Inspect. The data that displays depends on the element that you inspect.
Explore the underlying data for panels
editTo explore the underlying data of the panels on your dashboard, Kibana opens Discover, where you can view and filter the data in the visualization panel. When Kibana opens Discover, the index pattern, filters, query, and time range for the visualization continue to apply.
The Explore underlying data option is available only for visualization panels with a single index pattern.
To use the Explore underlying data option:
-
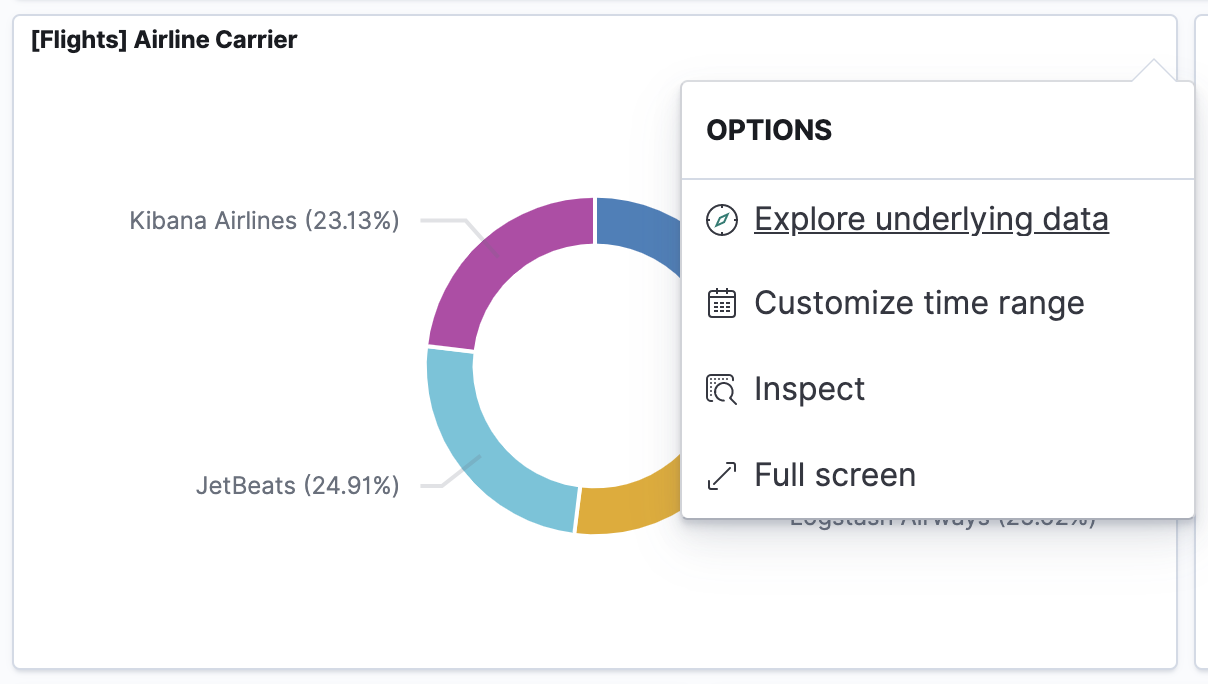
Click the from the panel menu, then click Explore underlying data.
-
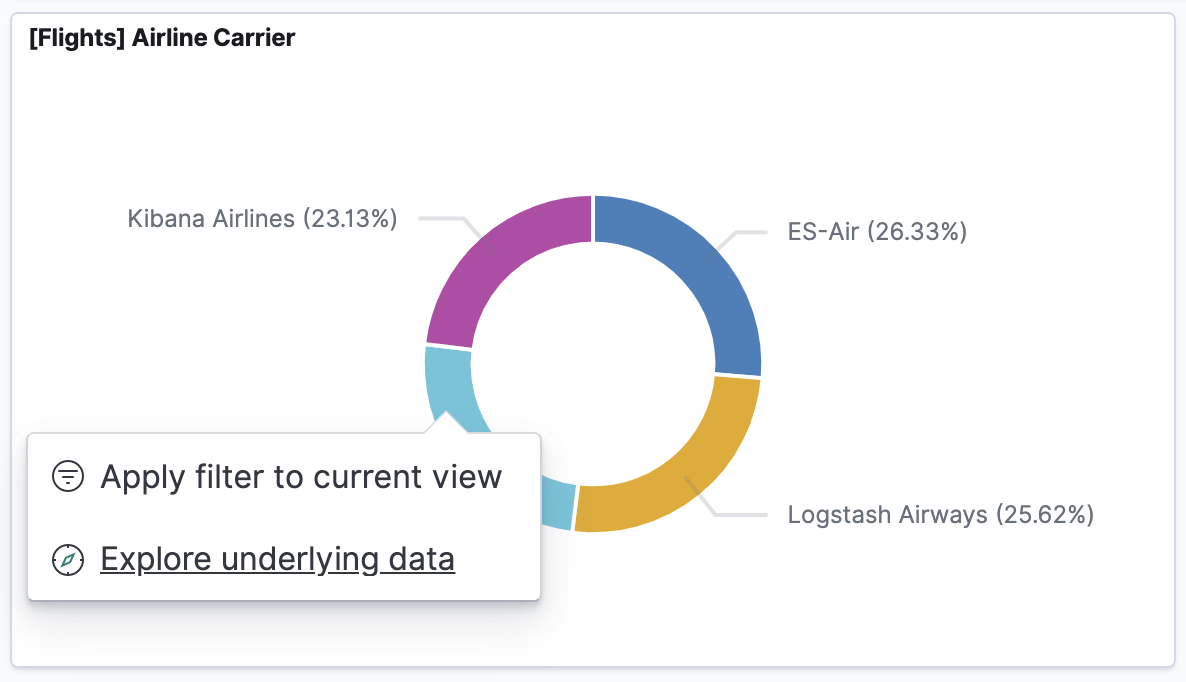
Interact with the chart, then click Explore underlying data on the menu that appears.
To enable, open
kibana.yml
, then add the following:
xpack.discoverEnhanced.actions.exploreDataInChart.enabled: true