WARNING: Version 5.5 of Kibana has passed its EOL date.
This documentation is no longer being maintained and may be removed. If you are running this version, we strongly advise you to upgrade. For the latest information, see the current release documentation.
Time Series Visual Builder
edit
IMPORTANT: This documentation is no longer updated. Refer to Elastic's version policy and the latest documentation.
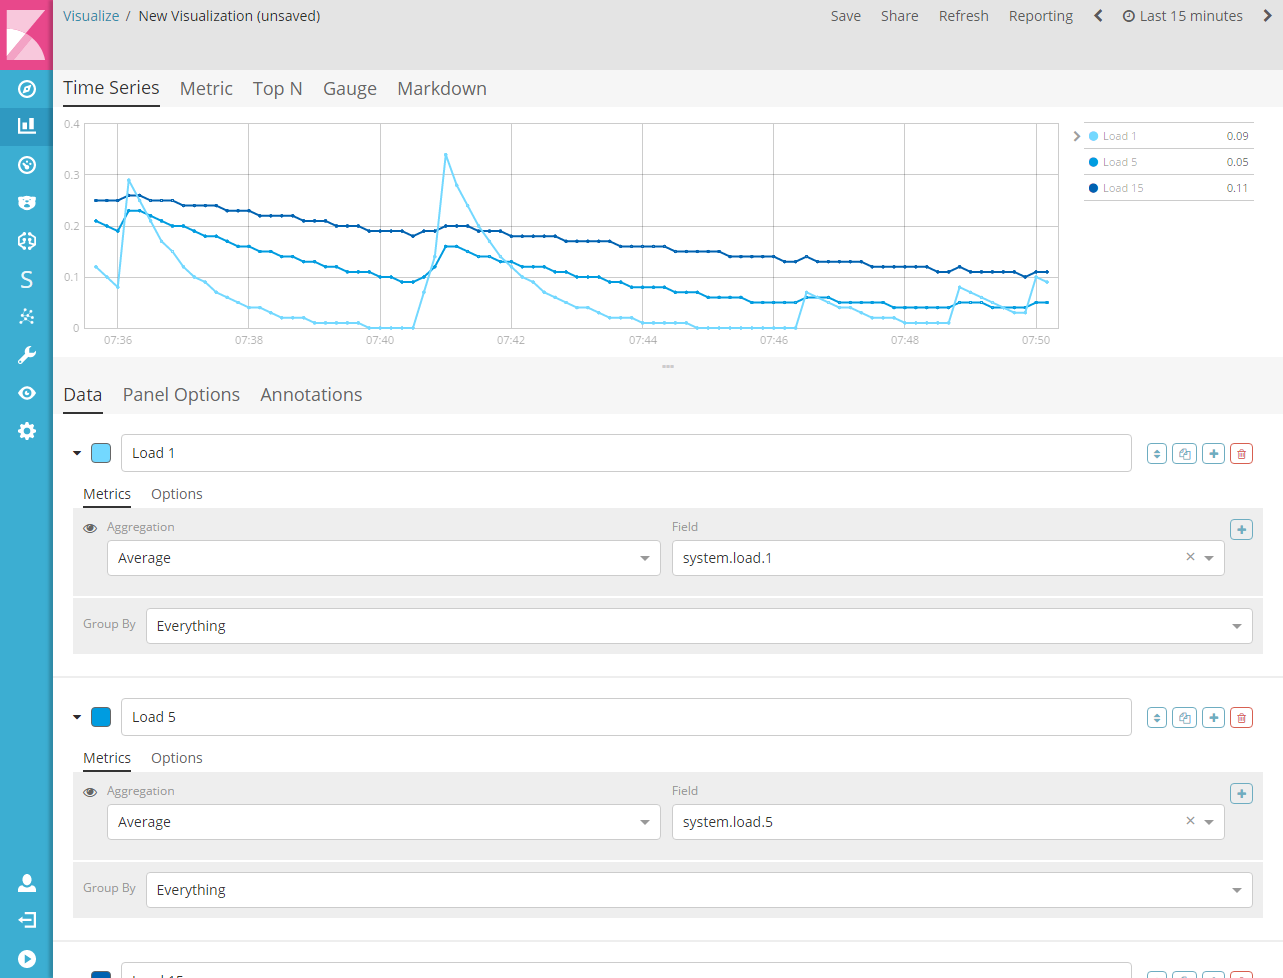
Time Series Visual Builder
editExperimental Feature
Time Series Visual Builder is a time series data visualizer with an emphasis on allowing you to use the full power of Elasticsearch aggregation framework. Time Series Visual Builder allows you to combine an infinite number of aggregations and pipeline aggregations to display complex data in a meaningful way.