How to view analytics events
editHow to view analytics events
editRefer to Analytics events reference for a complete list of the fields logged by events.
Once you’ve started tracking events using the Behavioral Analytics Tracker, you can view them in the Kibana UI.
View events in the Overview dashboard
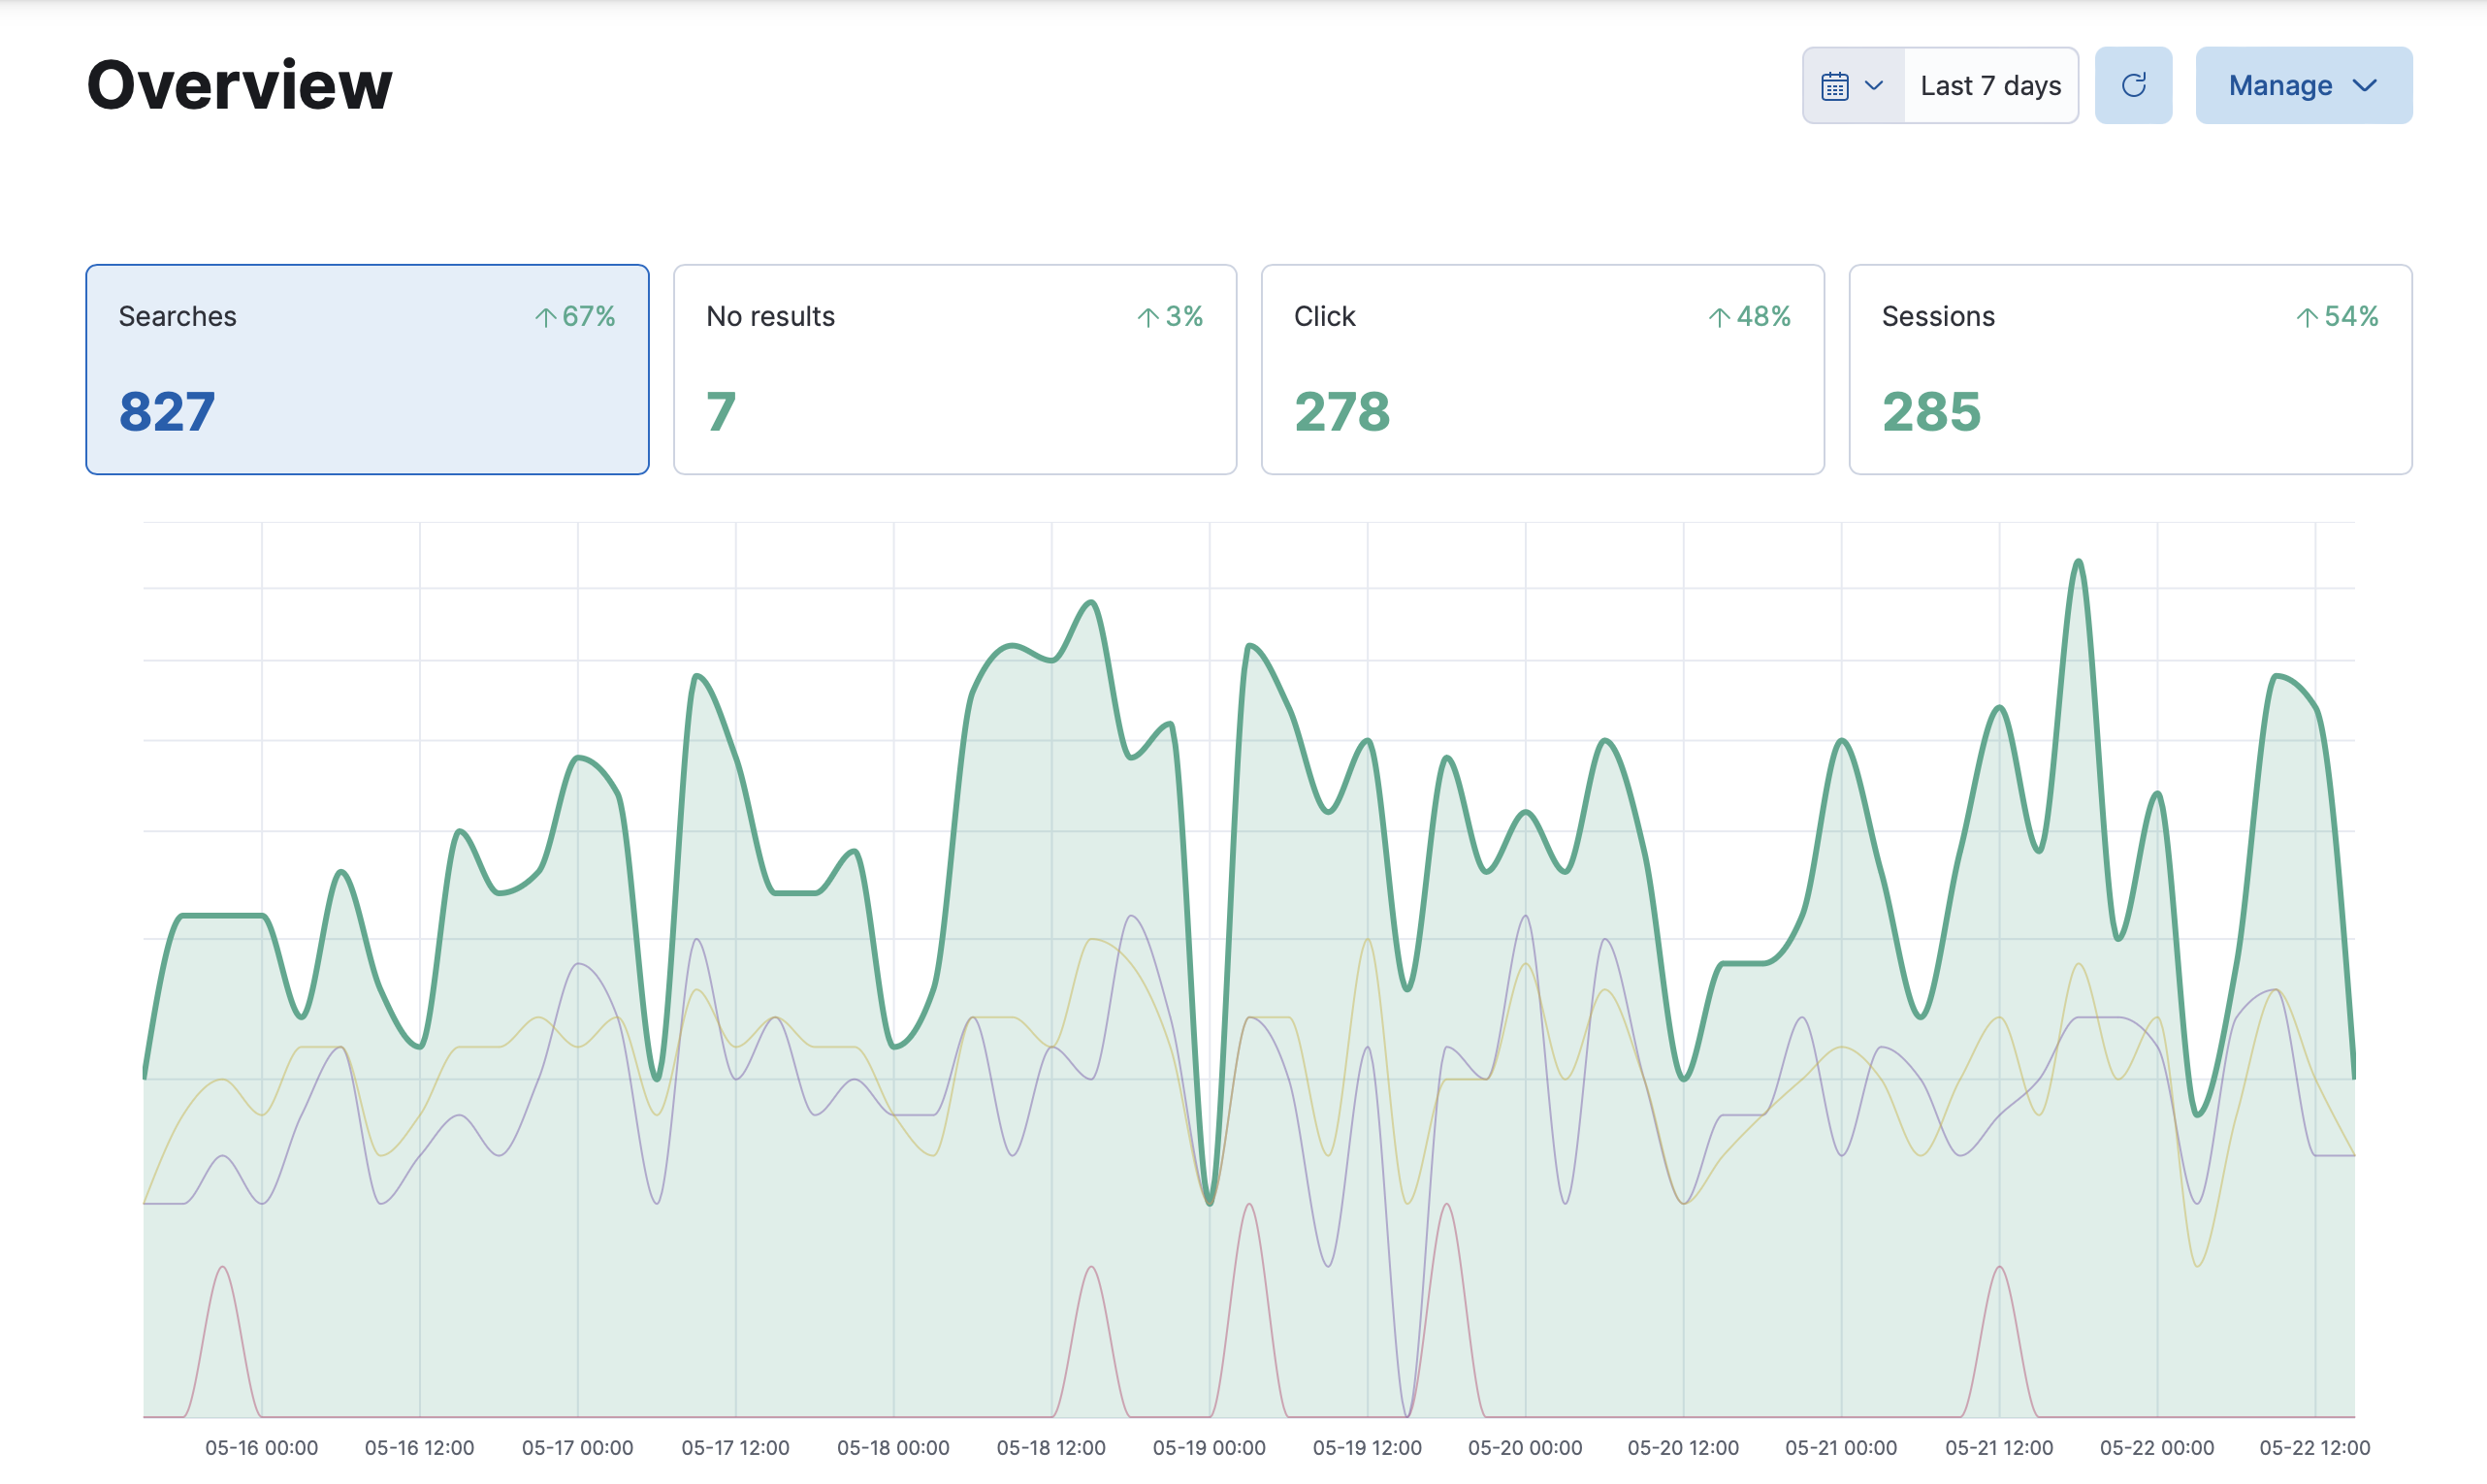
editThe Overview dashboard provides a quick overview of the following:
- Searches
- No results
- Clicks
- Sessions
This allows you to quickly check both absolute numbers and trends (tracked in percentage changes) about these events. Find this dashboard under Search > Behavioral Analytics> your-collection > Overview.
The following screenshot shows an example Overview dashboard:
View events in the Explorer dashboard
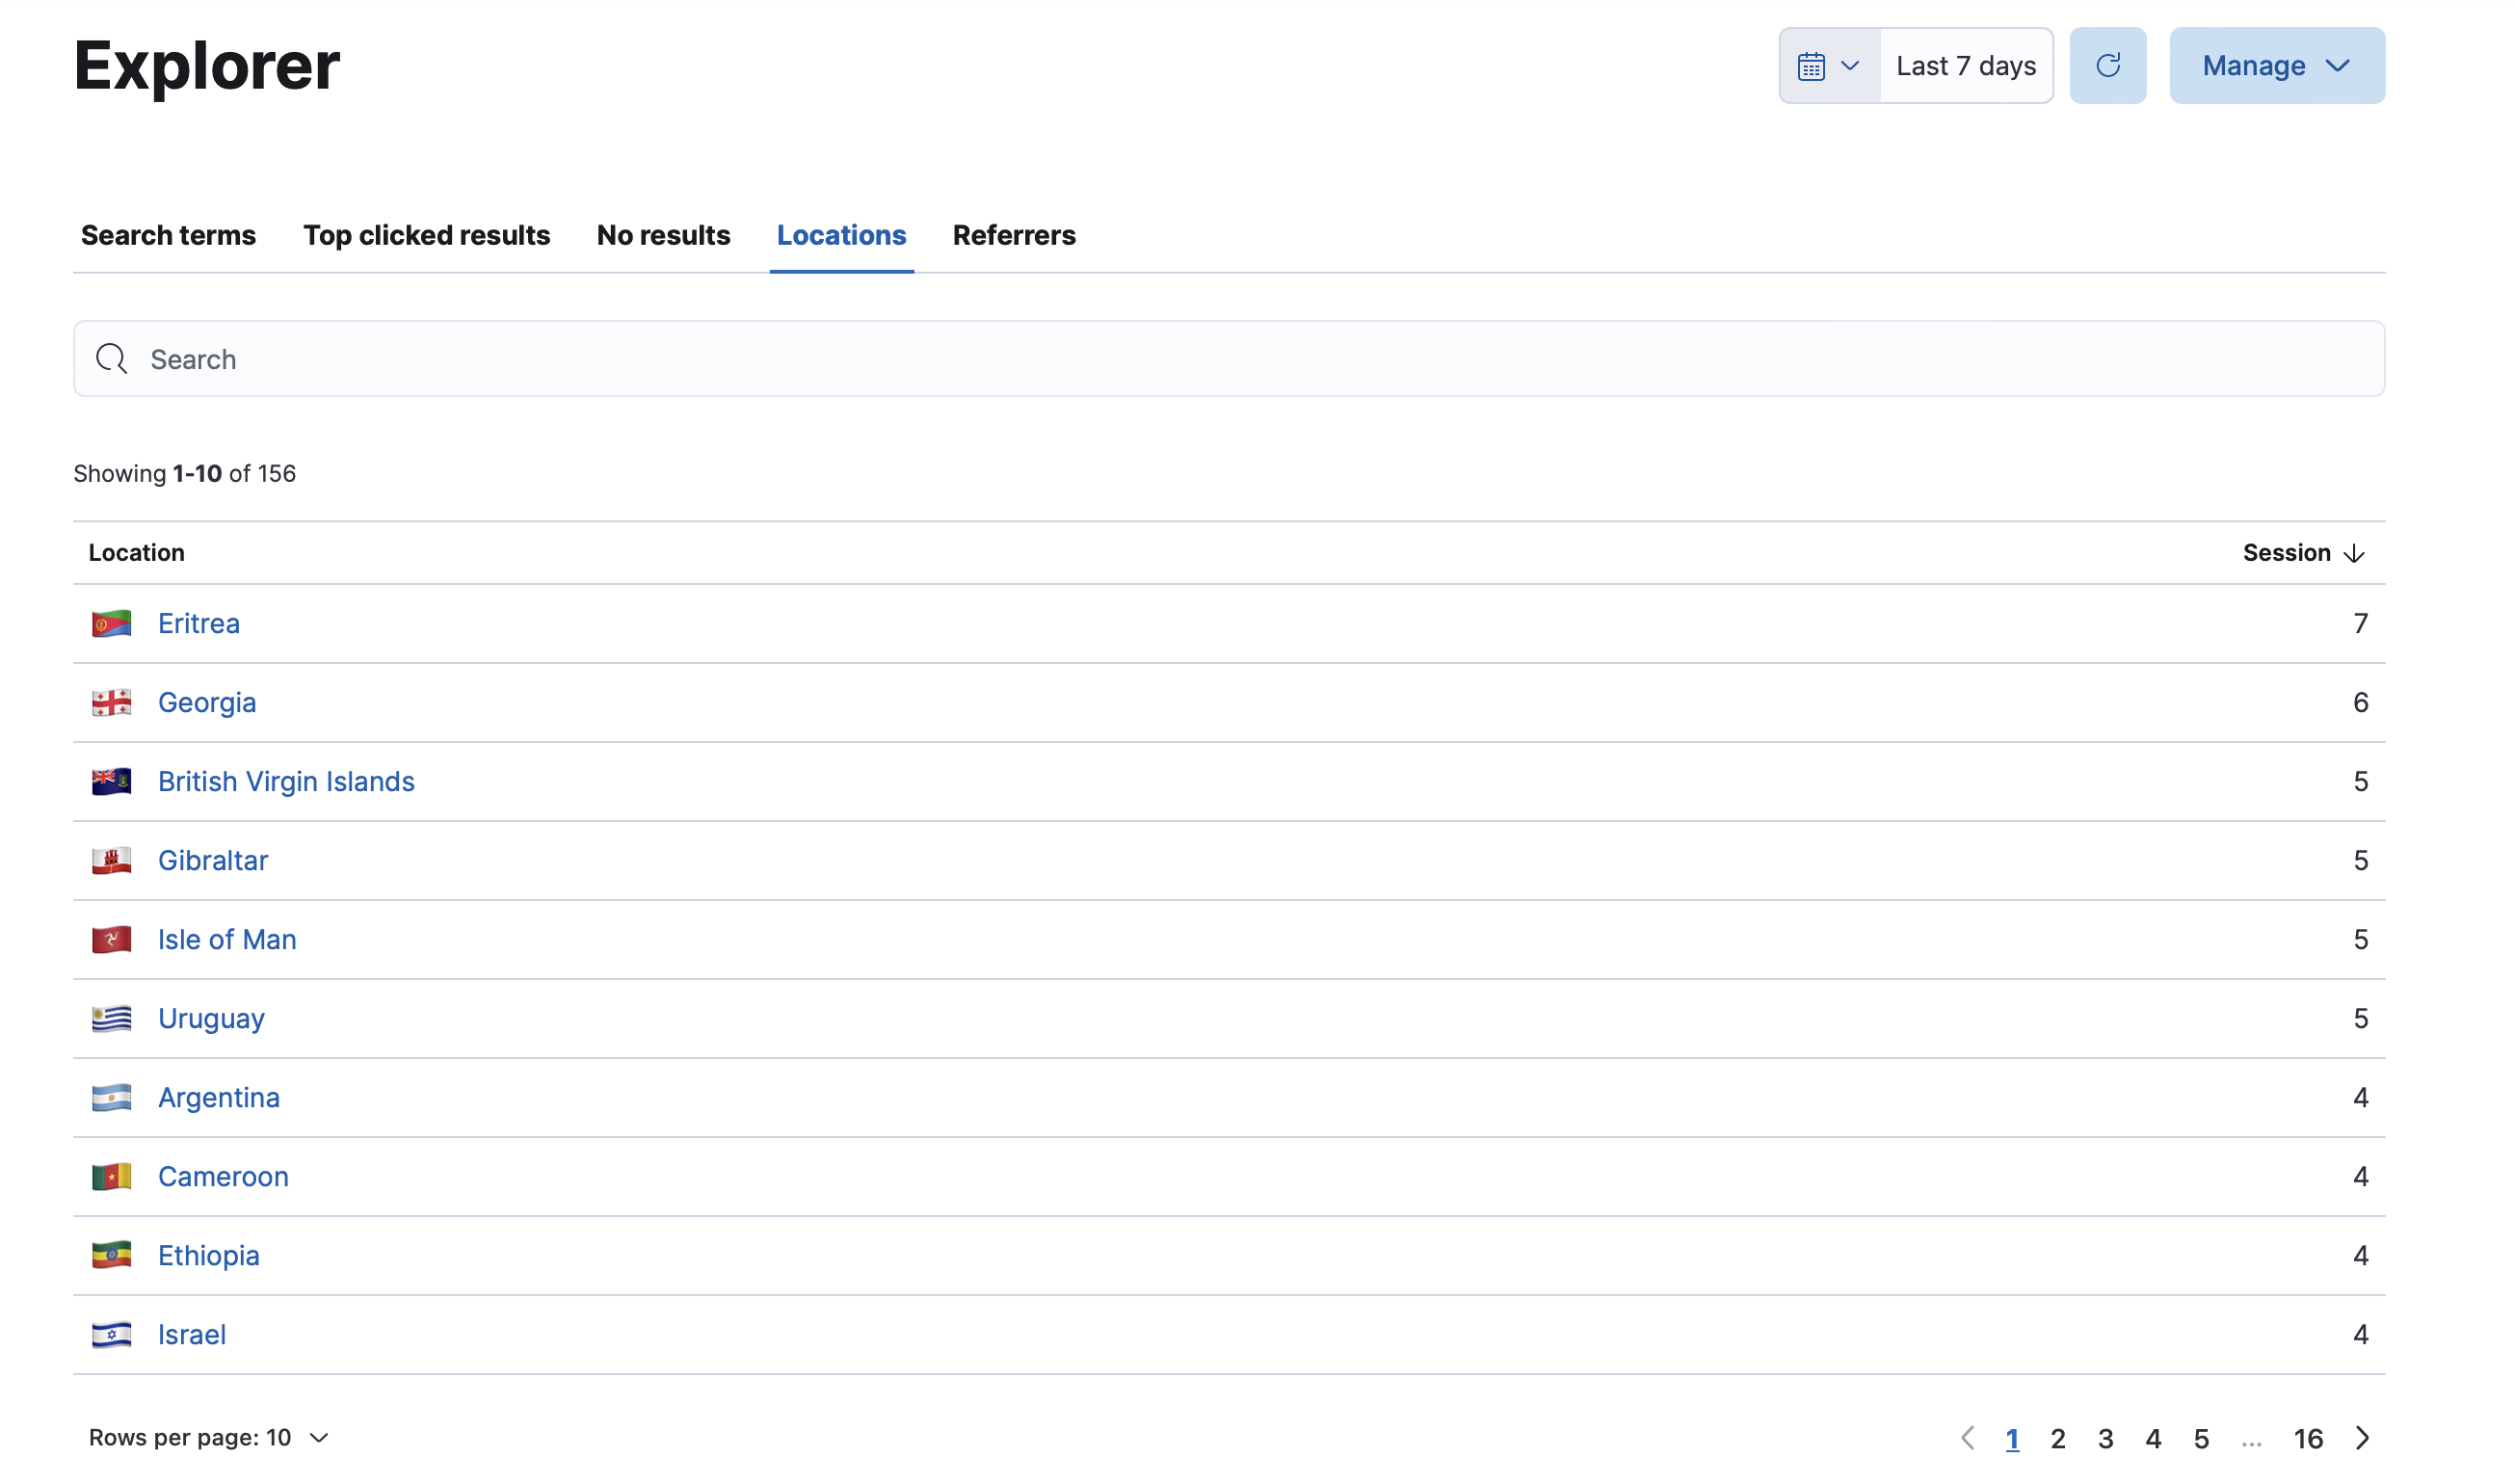
editThe Explorer dashboard provides a more detailed view of your events. Find this dashboard under Search > Behavioral Analytics> your-collection > Explorer.
Here you can find and search over the following:
- Search terms
- Top clicked results
- No results
- Locations
- Referrers
You can also easily sort in ascending or descending order by clicking on the header arrows.
The following screenshot shows the Locations tab of an Explorer dashboard, with a list of top locations in descending order:
Discover and Lens
editFor more detailed analysis, you can view events in the Kibana Discover app. The Behavioral Analytics UI will guide you here from the Explorer dashboard. You can dig into the details using Discover and then generate visualizations using Lens.
Discover works with data views.
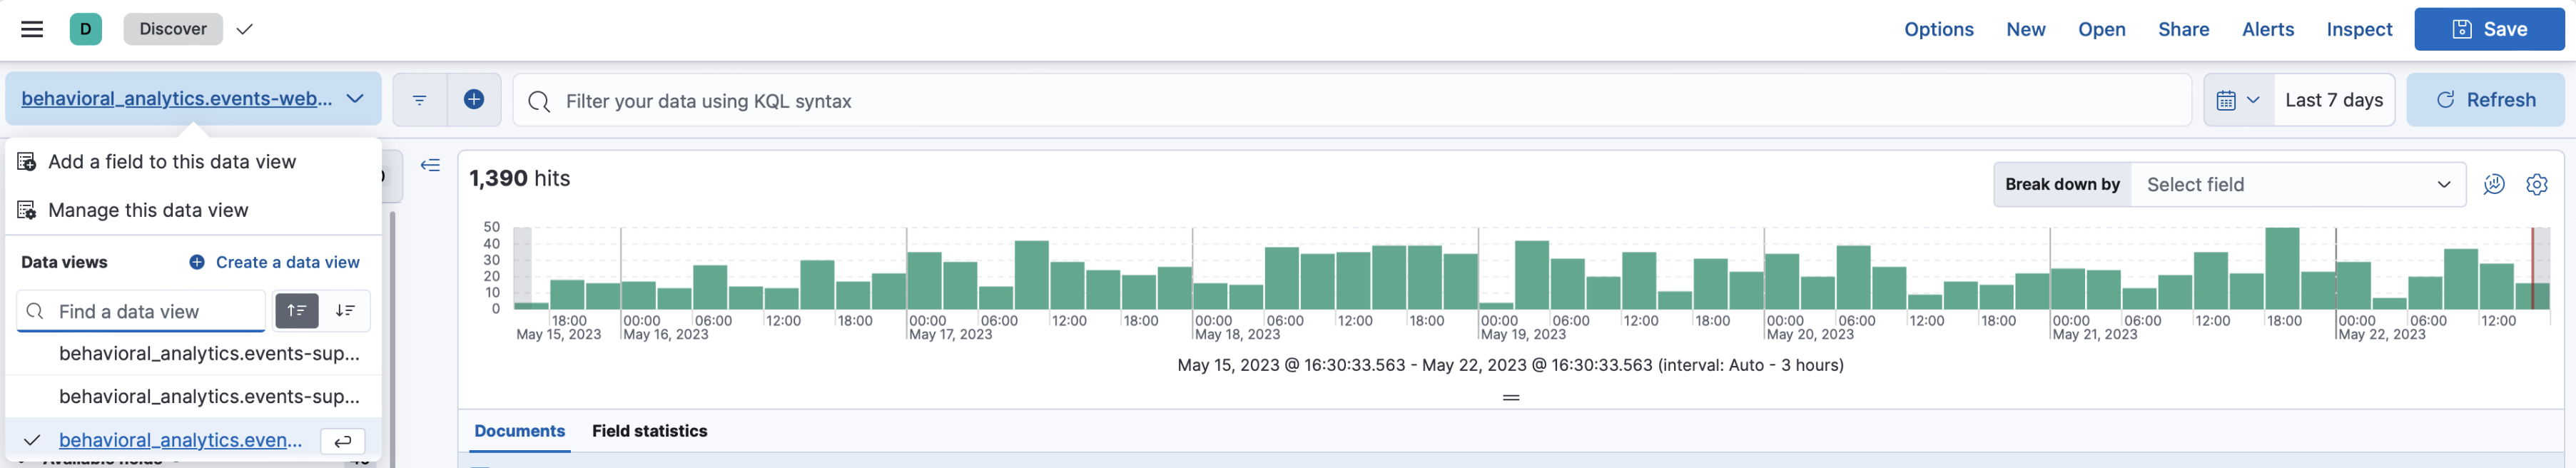
You’ll find a data view automatically created for your collection, named behavioral_analytics.events-<your-collection>.
This data view will be pre-selected in the data view dropdown menu.
Use this menu to switch between data views for different collections.
The following screenshot shows you where to find the data view dropdown menu in Discover:
Discover has a lot of options, but here’s a quick overview of how to get started:
-
Filter your data by searching for terms, such as
search,page_view, andsearch_click. You’ll see a time series of hits that match your search. -
Search for "event" in the field name search bar. For example:
-
Select
event.action. You’ll find a list of all the events you’ve sent and their frequency distribution.
-
Select
-
Search for
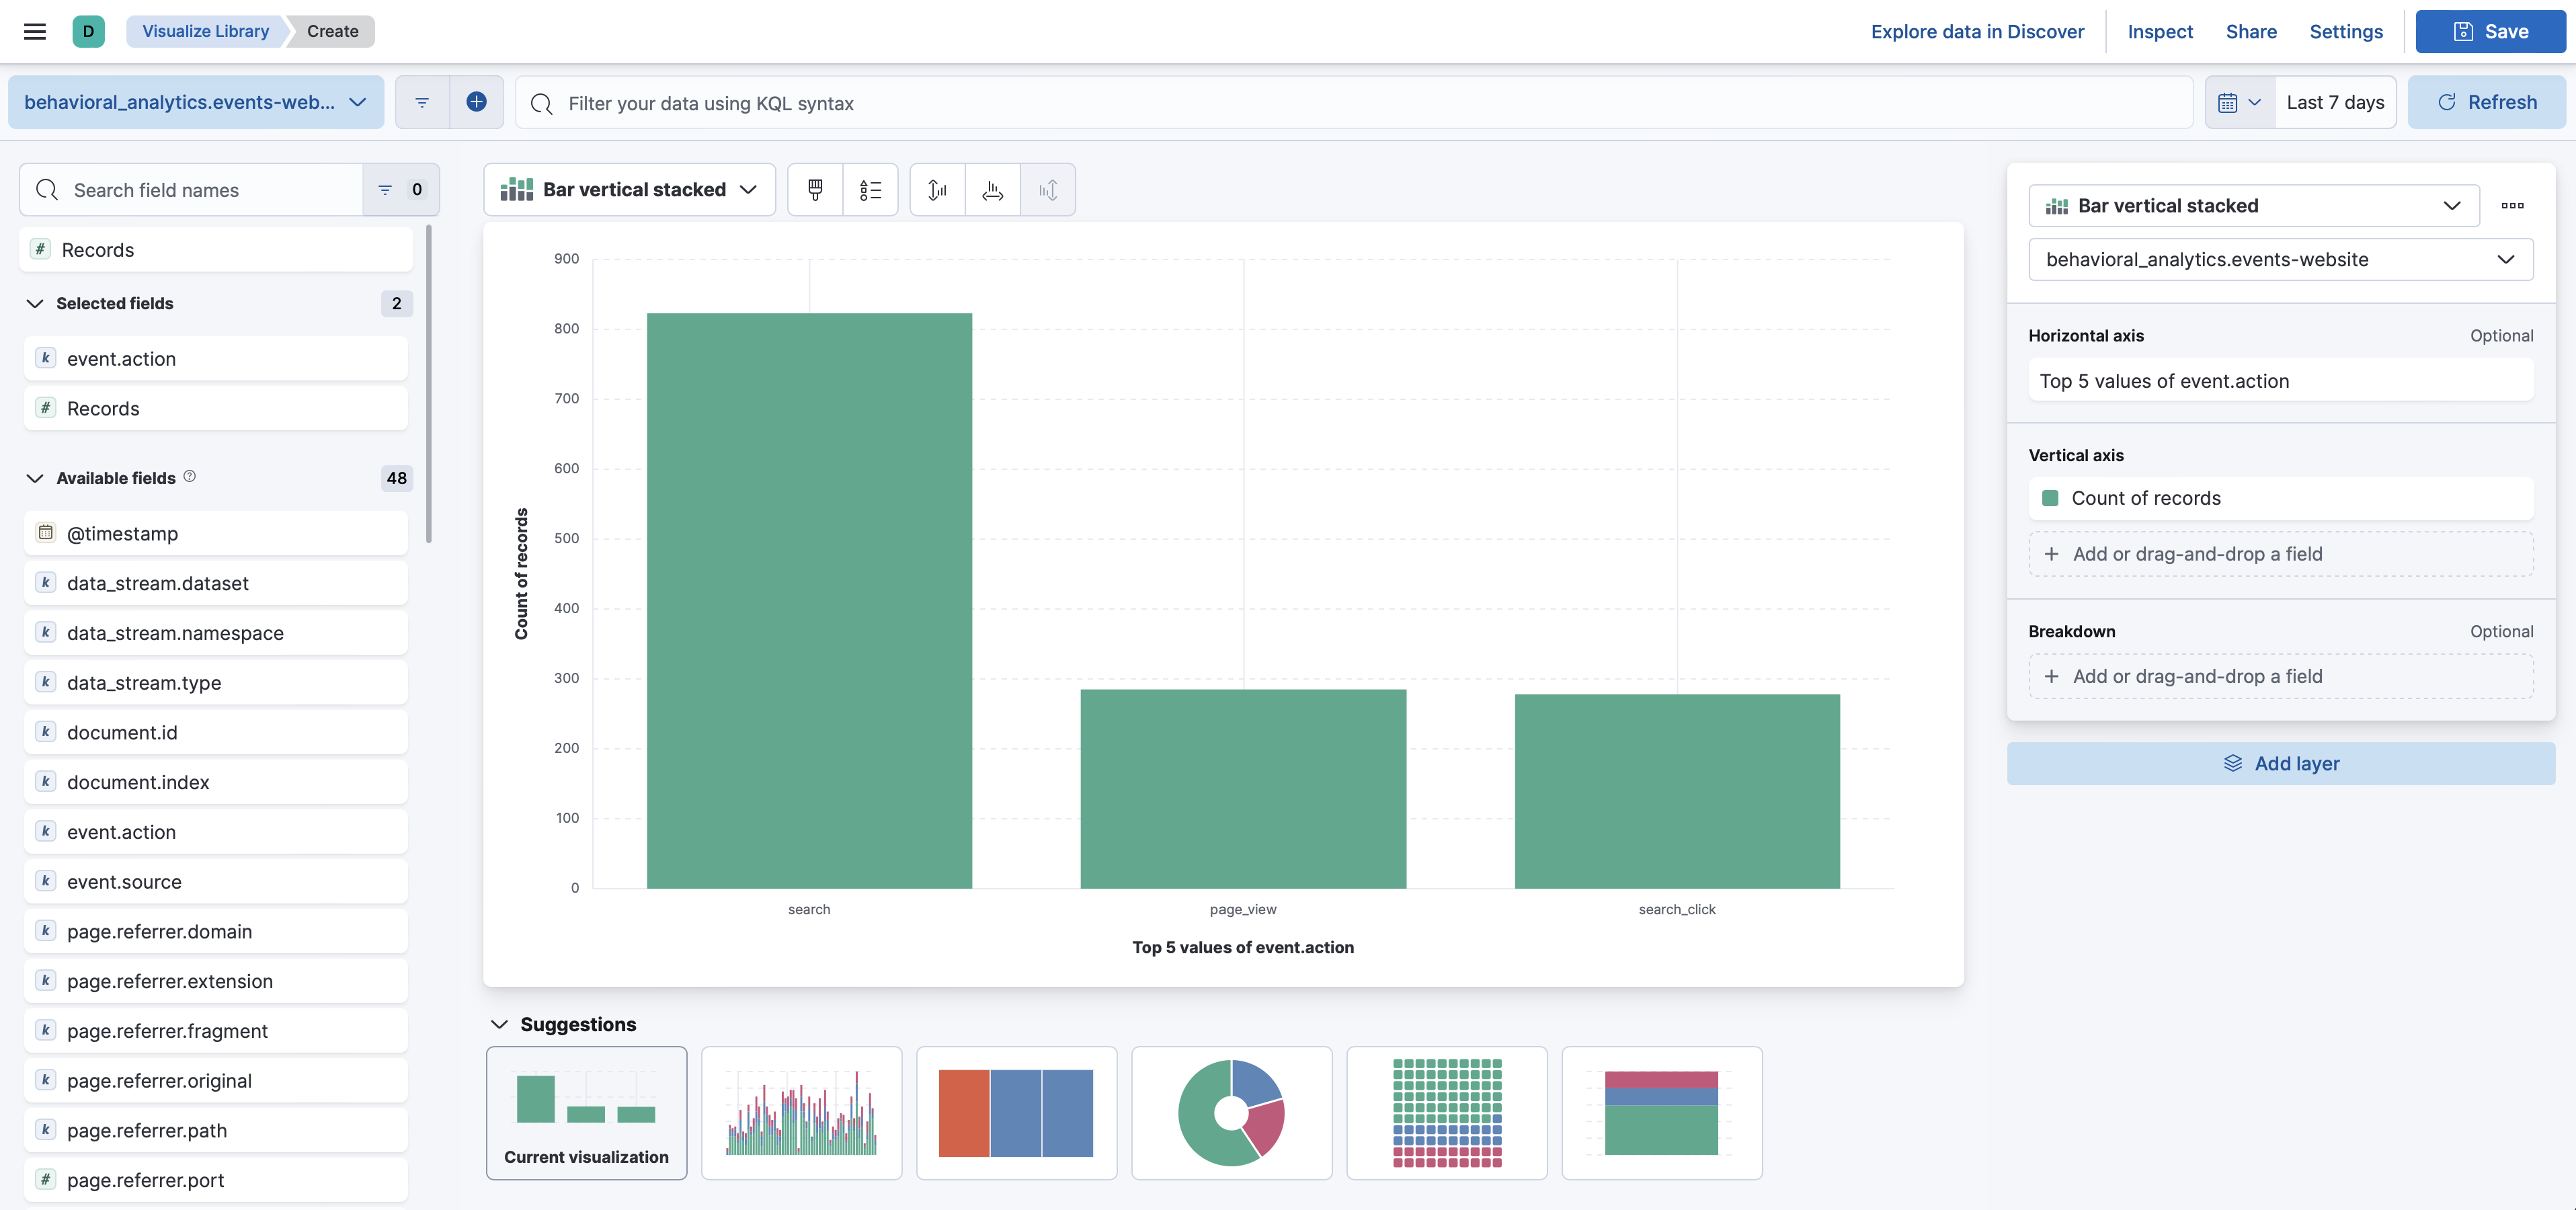
search.queryto find all search queries. - Select Visualize to create a Lens visualization.
The following screenshot shows a Lens visualization of an event.action distribution:
Learn more
editRead the Discover documentation.
Read the Lens documentation.