IMPORTANT: No additional bug fixes or documentation updates
will be released for this version. For the latest information, see the
current release documentation.
PowerShell Module
edit
IMPORTANT: This documentation is no longer updated. Refer to Elastic's version policy and the latest documentation.
PowerShell Module
editThe PowerShell module processes event log records from the Microsoft-Windows-PowerShell/Operational and Windows PowerShell logs.
The module has transformations for the following event IDs:
- 400 - Engine state is changed from None to Available.
- 403 - Engine state is changed from Available to Stopped.
- 600 - A Provider is Started.
- 800 - Pipeline executed.
- 4103 - Module logging.
- 4104 - Script block logging.
- 4105 - Command started.
- 4106 - Command completed.
Configuration
editBy default, module and script block logging (event ID’s 410x) are disabled, to enable them you can do so through "Windows Powershell" GPO settings and set "Turn on Module Logging" and "Turn on PowerShell Script Block Logging" to enabled.
Alternatively they can be enabled setting the following registry values:
HKCU/HKLM\SOFTWARE\Policies\Microsoft\Windows\PowerShell\ModuleLogging: EnableModuleLogging = 1
HKCU/HKLM\SOFTWARE\Policies\Microsoft\Windows\PowerShell\ModuleLogging \ModuleNames: * = *
HKCU/HKLM\SOFTWARE\Policies\Microsoft\Windows\PowerShell\ScriptBlockLogging: EnableScriptBlockLogging = 1
HKCU/HKLM\SOFTWARE\Policies\Microsoft\Windows\PowerShell\ScriptBlockLogging: EnableScriptBlockInvocationLogging = 1
winlogbeat.event_logs:
  - name: Windows PowerShell
    event_id: 400, 403, 600, 800

  - name: Microsoft-Windows-PowerShell/Operational
    event_id: 4103, 4104, 4105, 4106

output.elasticsearch.pipeline: winlogbeat-%{[agent.version]}-routing
|
All module processing is handled via Elasticsearch Ingest Node pipelines. See Setup of Ingest Node pipelines for details. |
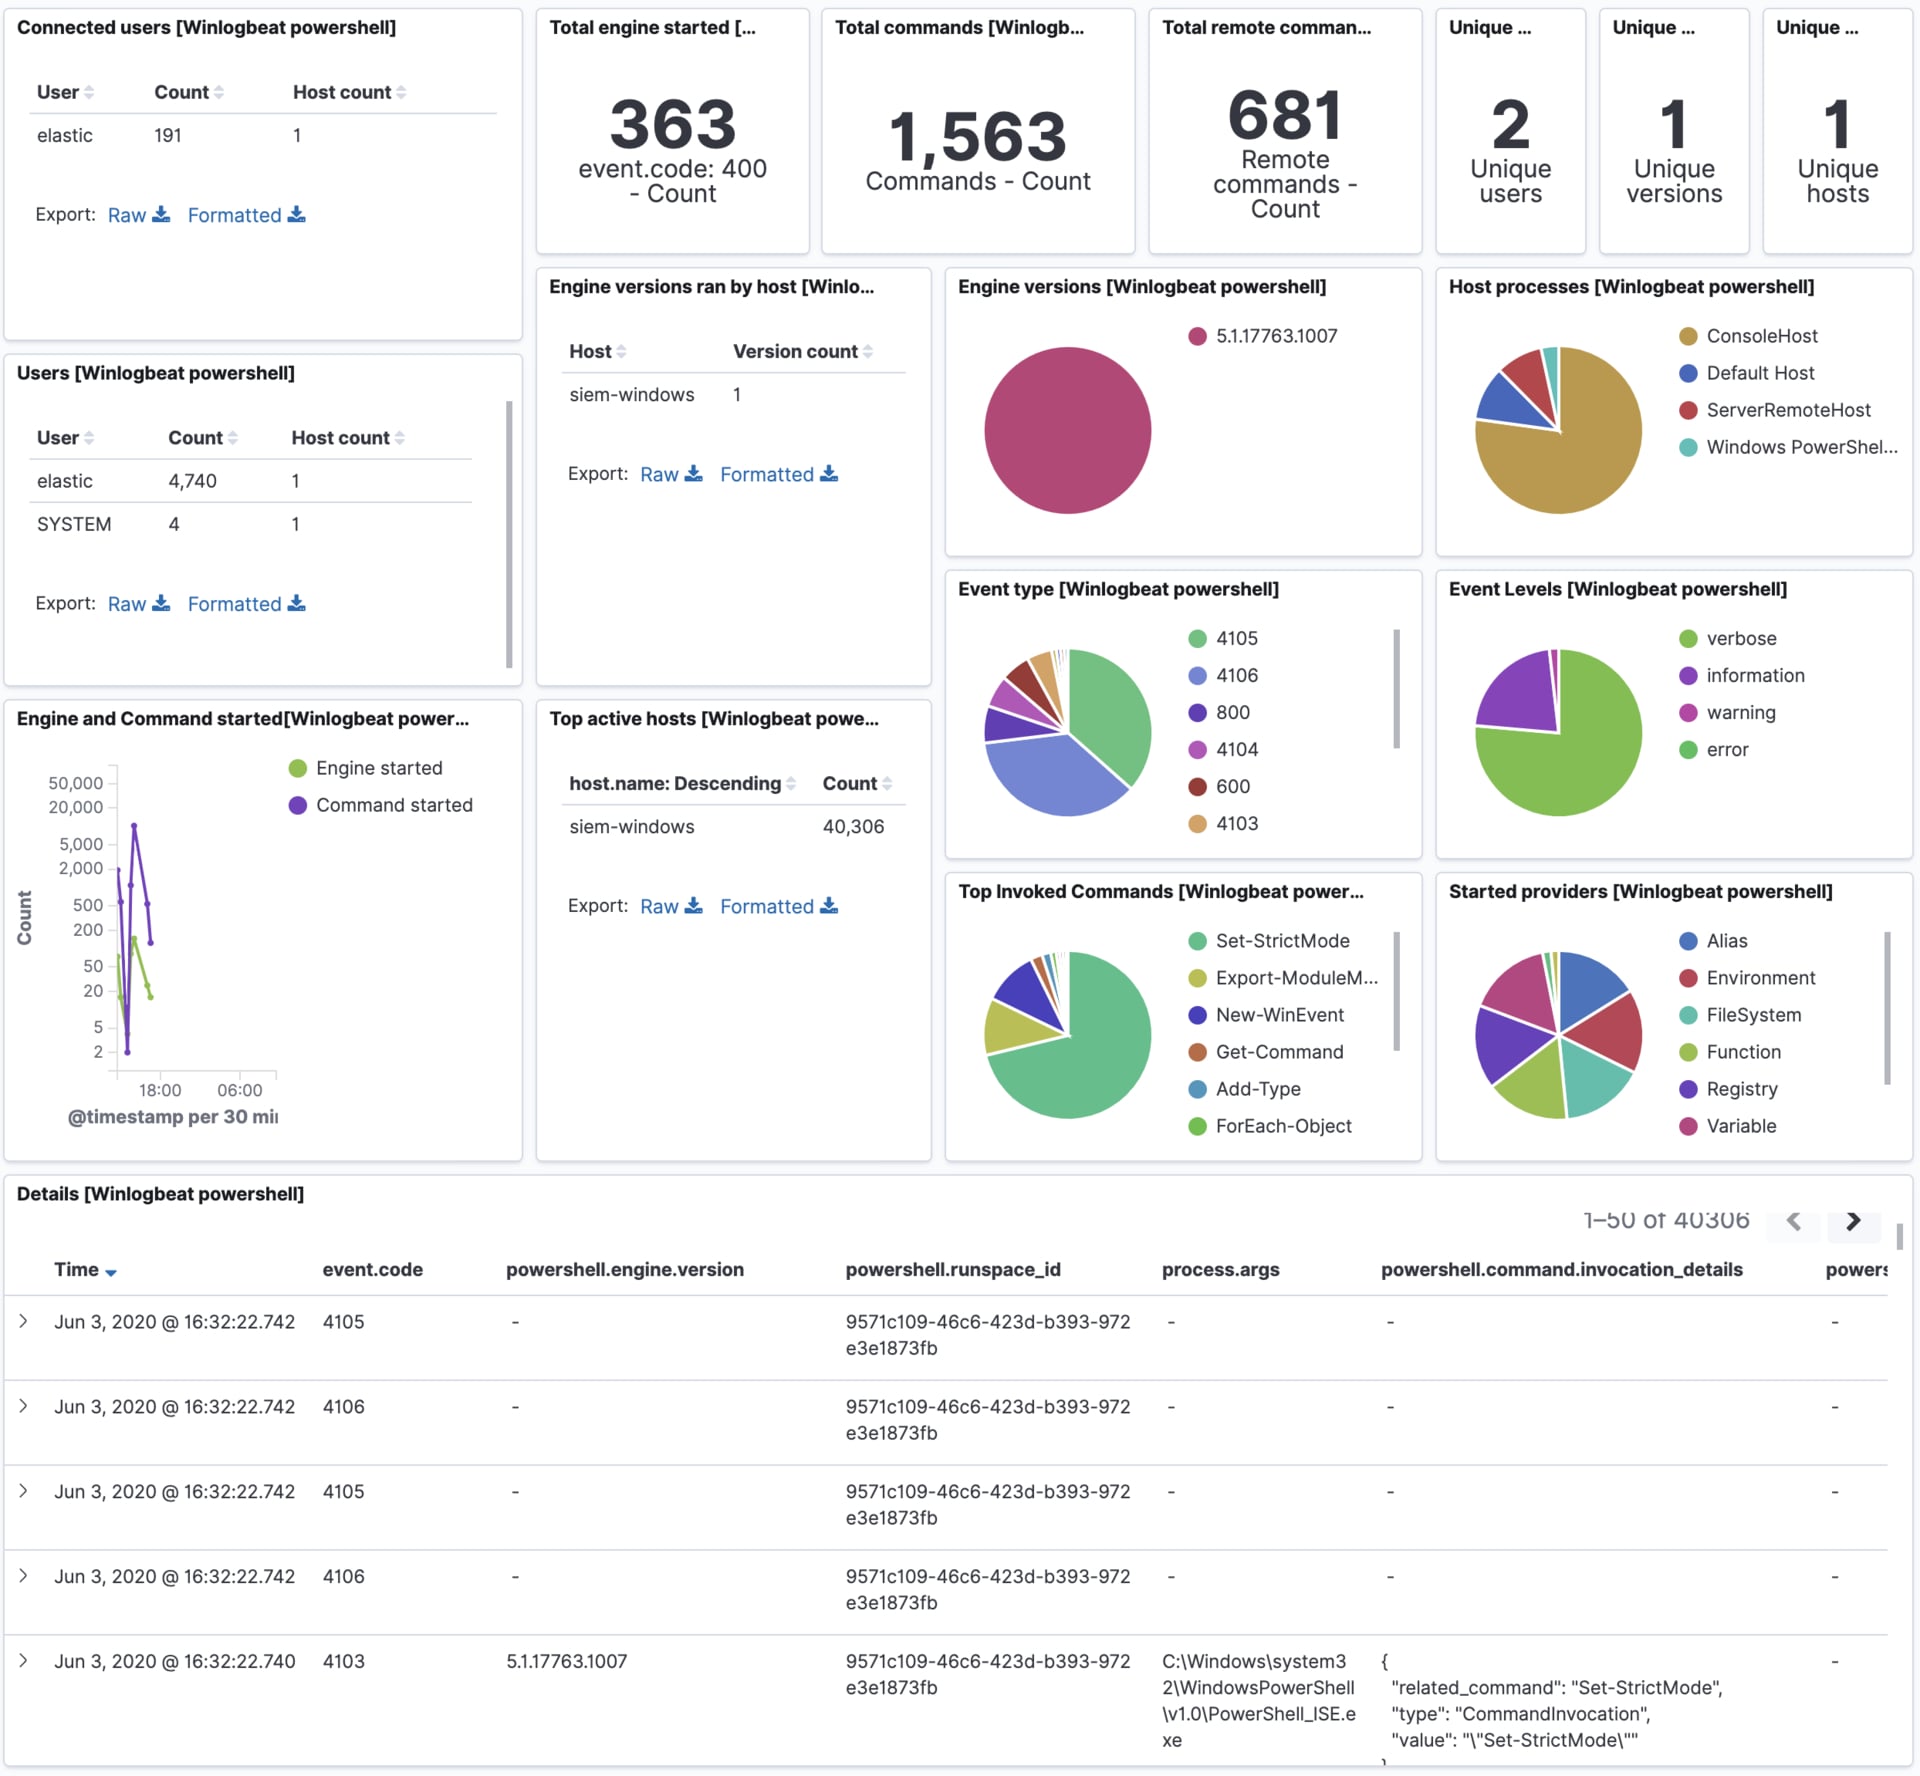
Example dashboard
editThis module comes with a sample dashboard.