Elastic APM 7.5.0 released
We are pleased to announce the release of Elastic APM 7.5.0 — available on the Elasticsearch Service, or as part of the default distribution of Elastic Stack. This release brings exciting new changes to the APM app that simplify APM configuration and allows for navigation between logs and additional config options to administer your APM agents.
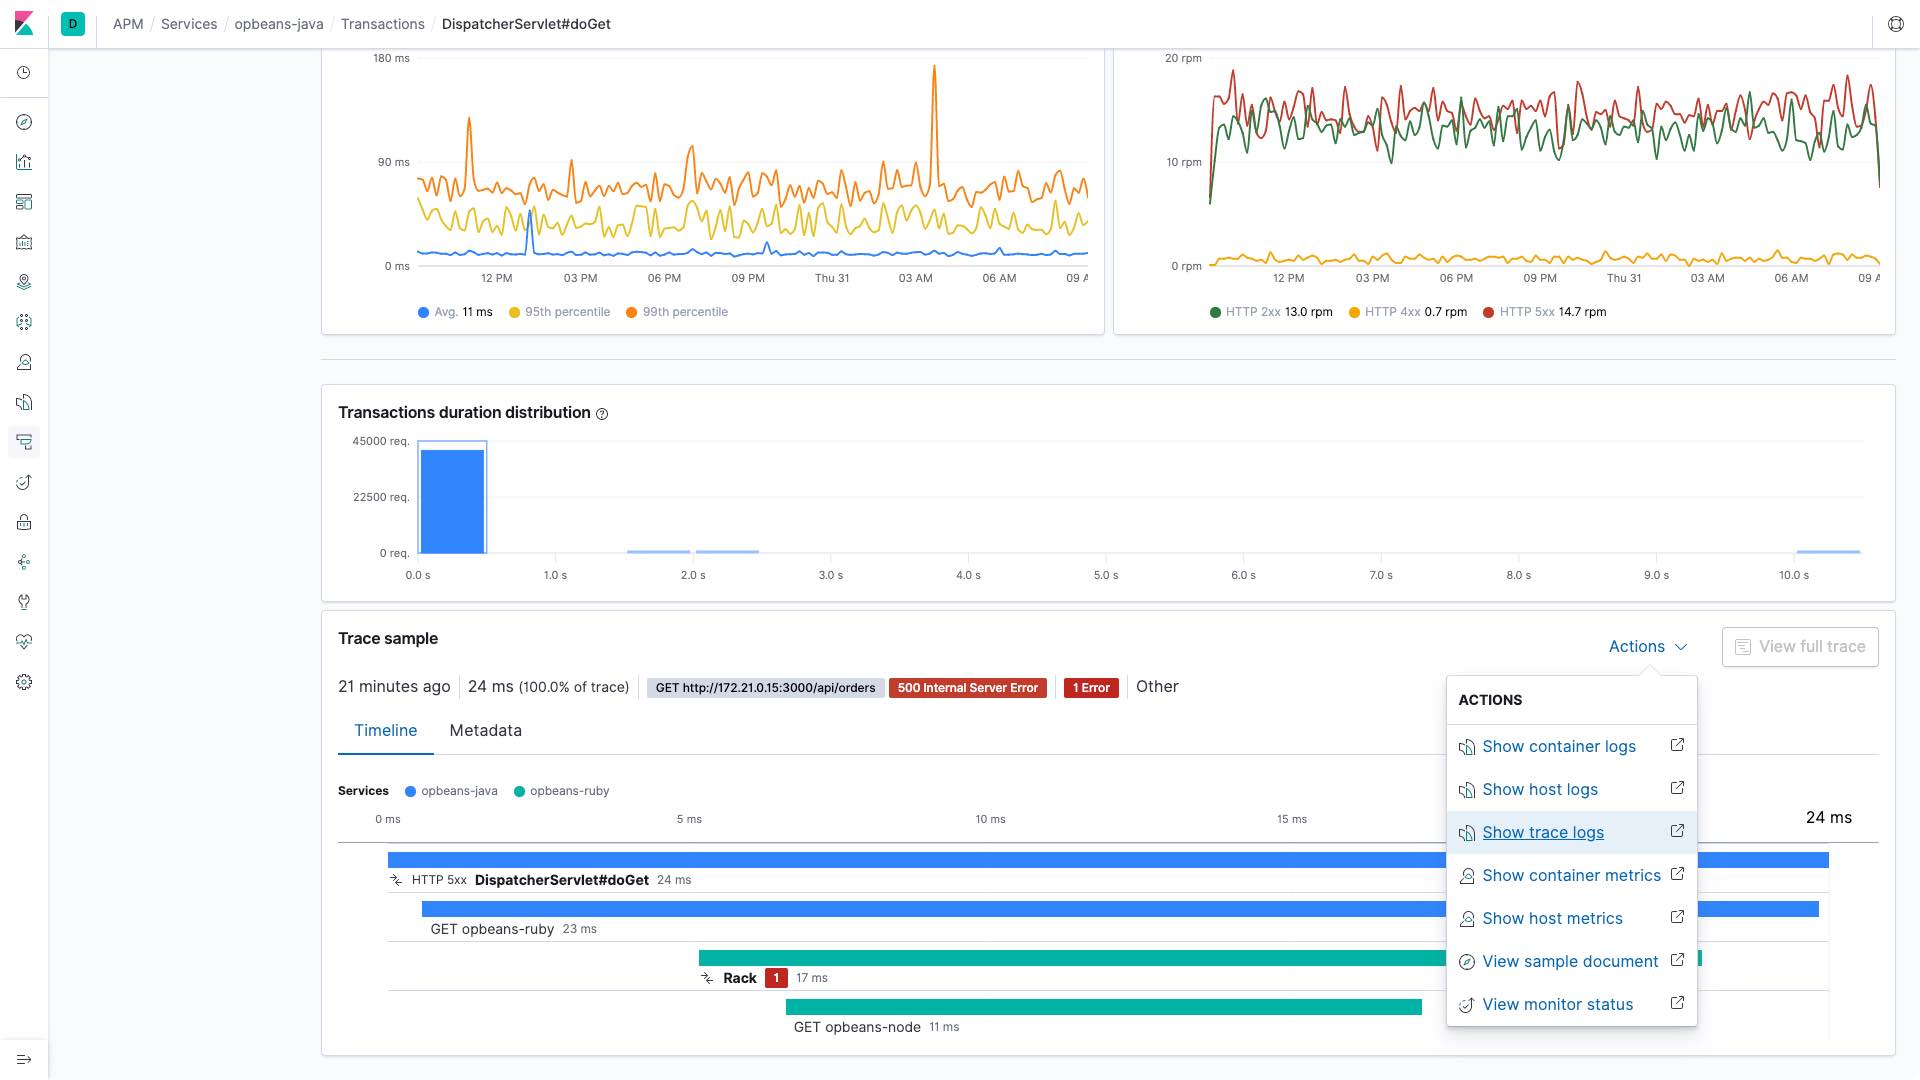
Easier navigation between APM traces and logs
Navigation from APM traces to logs was introduced in 7.4. In 7.5 this feature is significantly expanded, with support for writing the trace unique identifier (ID) into log messages for all Elastic APM agents. APM agents write these structured logs directly in Elastic Common Schema (ECS) format. The Elastic APM and Logs apps leverage these correlation IDs introduced by the agents to navigate between traces and logs in a deterministic manner. This capability simplifies the troubleshooting experience by bringing together trace and log data related to a slow or failed APM transaction with the click of a button. Check out the agent docs for information on supported logging libraries.

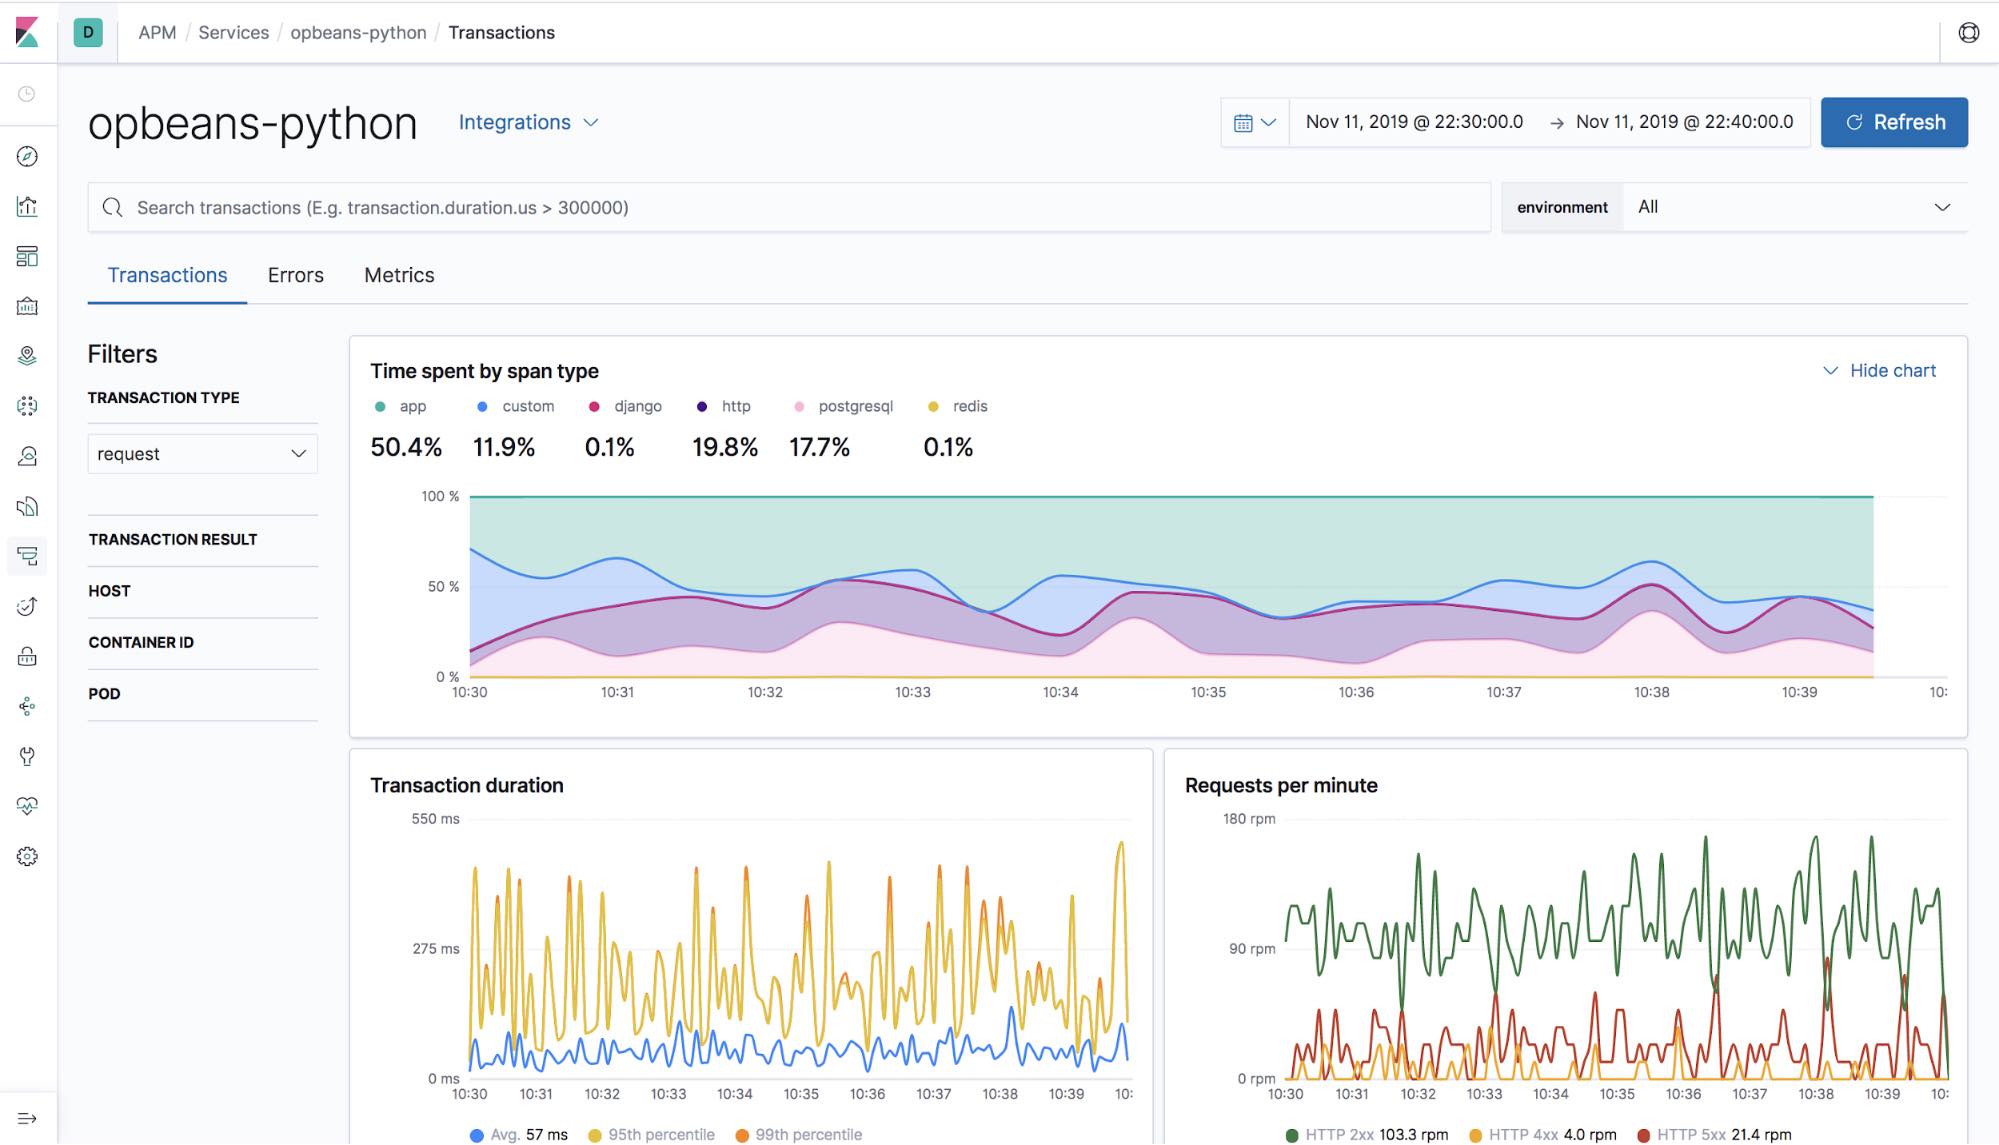
Aggregate service breakdown charts are now GA!
Breakdown graphs were added in 7.3 to the APM app. These graphs help you easily visualize where your application are spending most of their time. In 7.5 these graphs are now GA, which means you can now see the aggregated performance breakdown of your applications and easily identify hotspots for all your applications (not available for .NET agent).

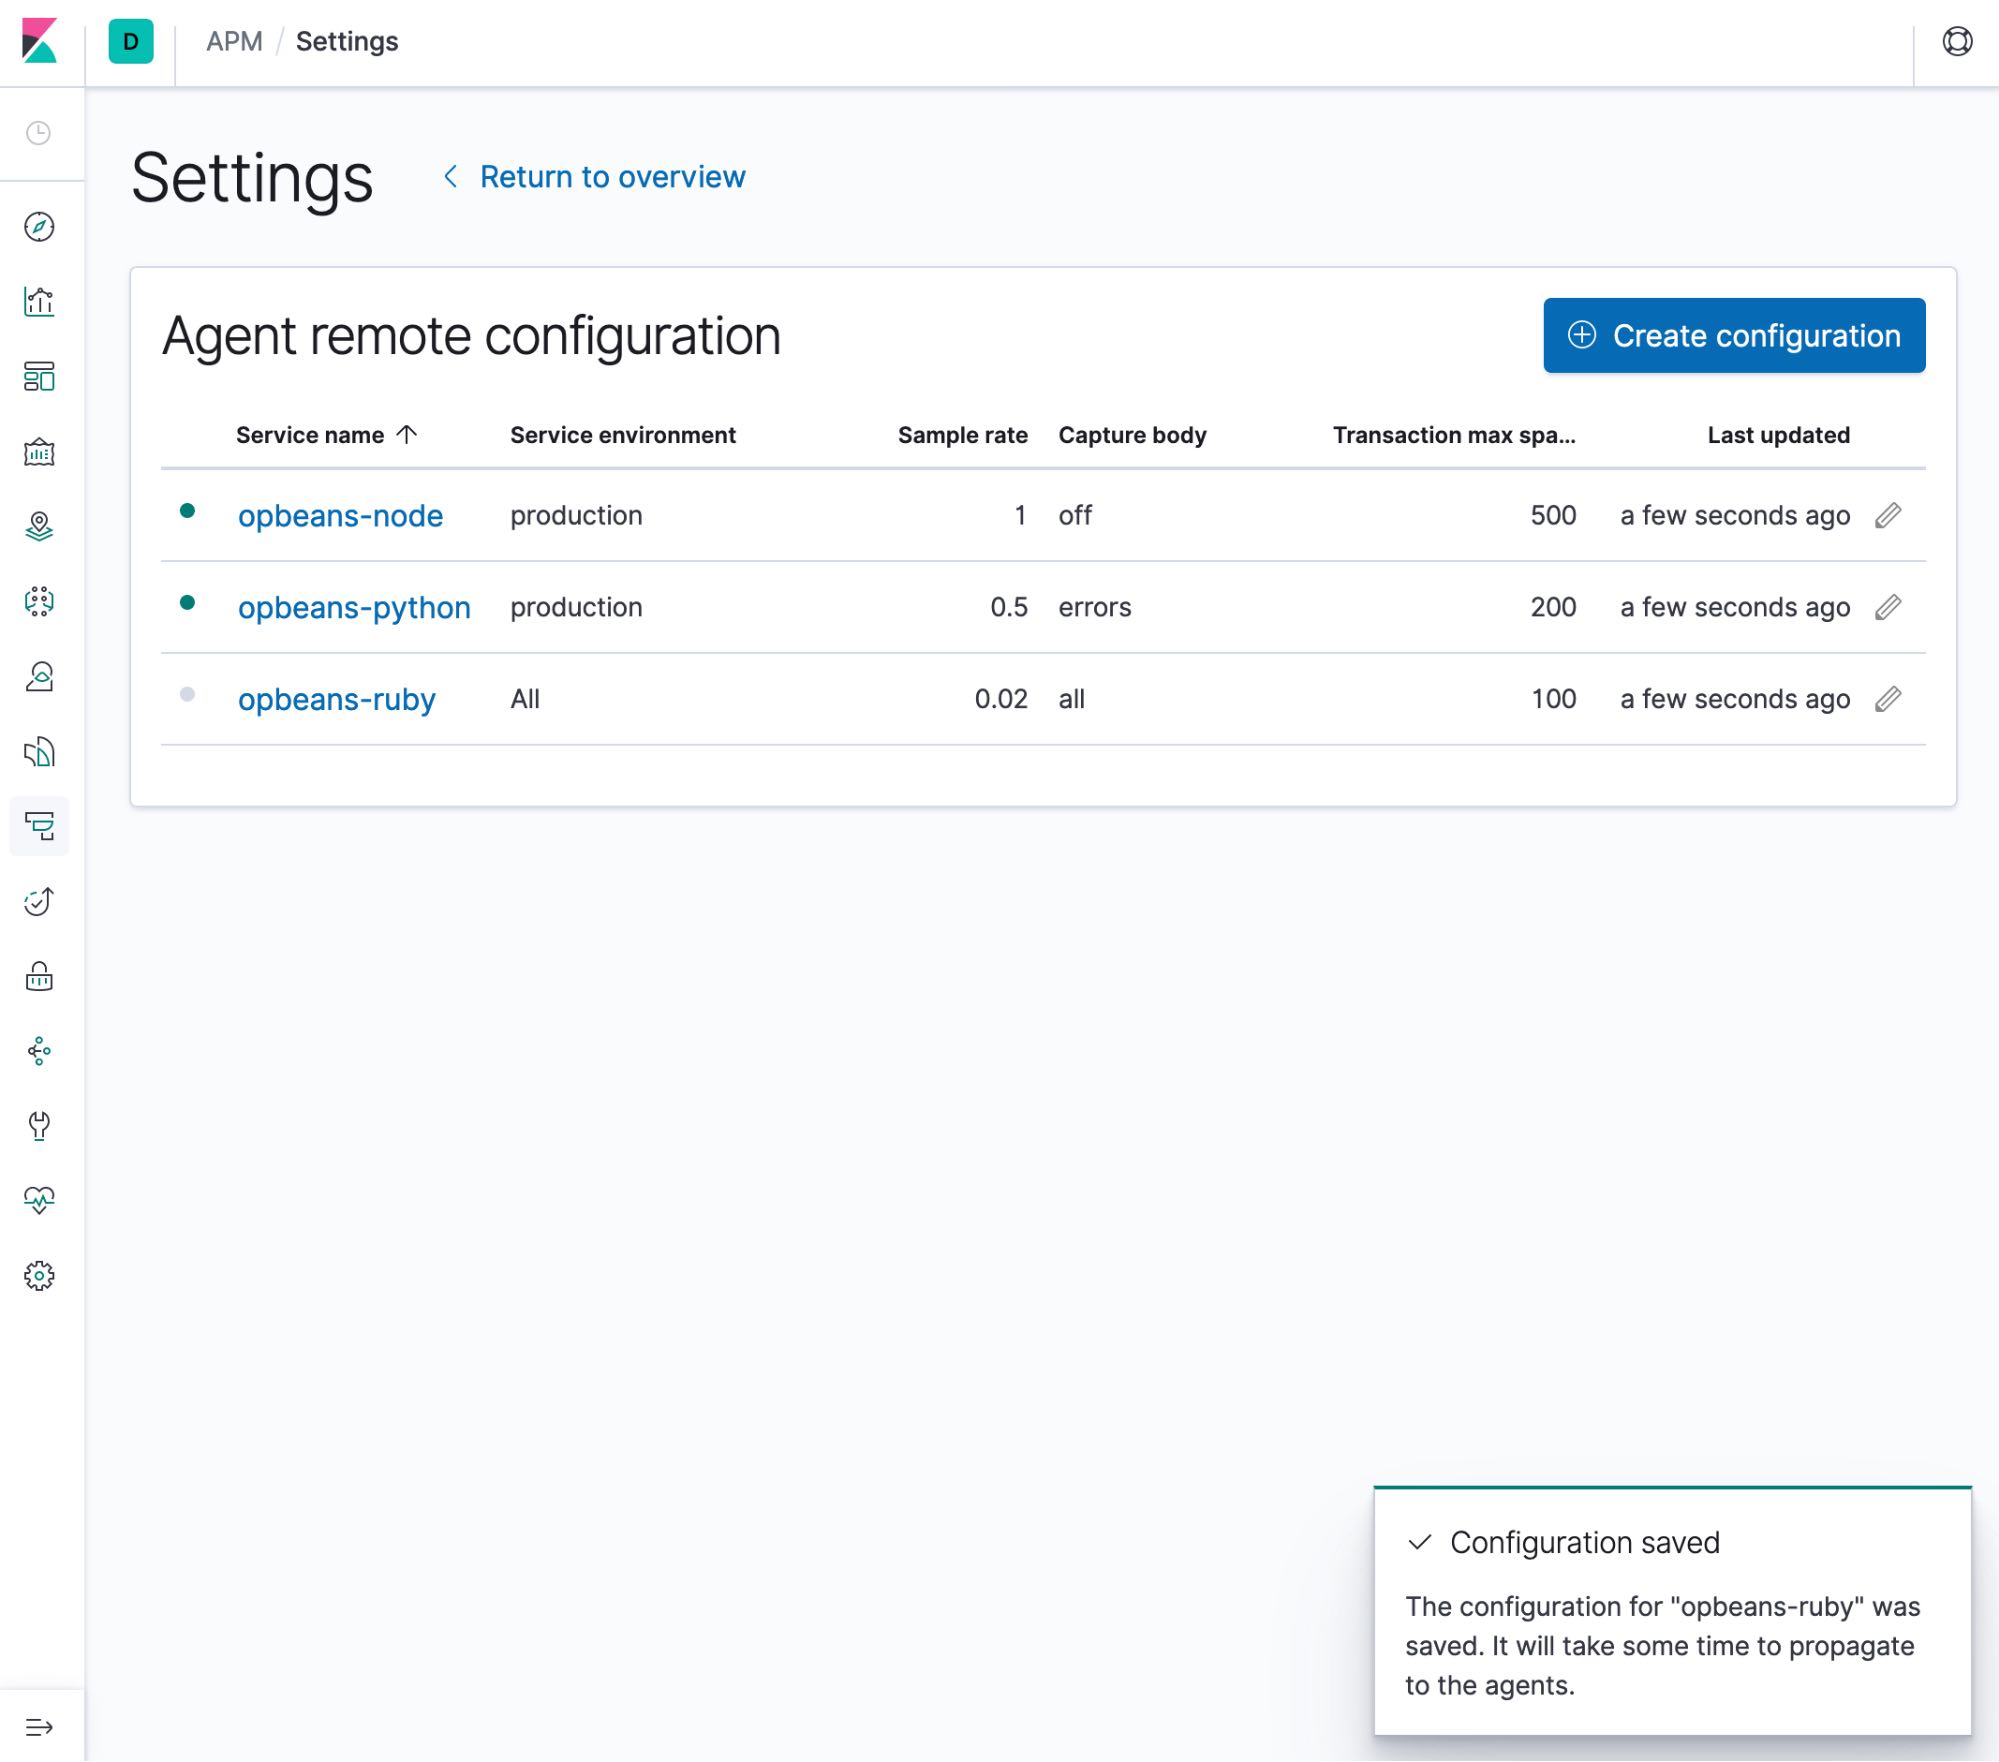
More config options in the APM app
In 7.3 we shipped support for configuring sampling rate for your services from the APM app. In 7.5 we've added support for two additional configurations — one that allows you to configure the capture body of transactions, and another to configure the maximum number of spans that can be sent up from the agent. The ability to configure these settings from the UI allows you to easily edit an agent’s configuration without needing to change the individual agent configuration files. In addition to these configuration options, the UI also has visual indicators that provide feedback and let you know if a particular configuration was applied successfully.

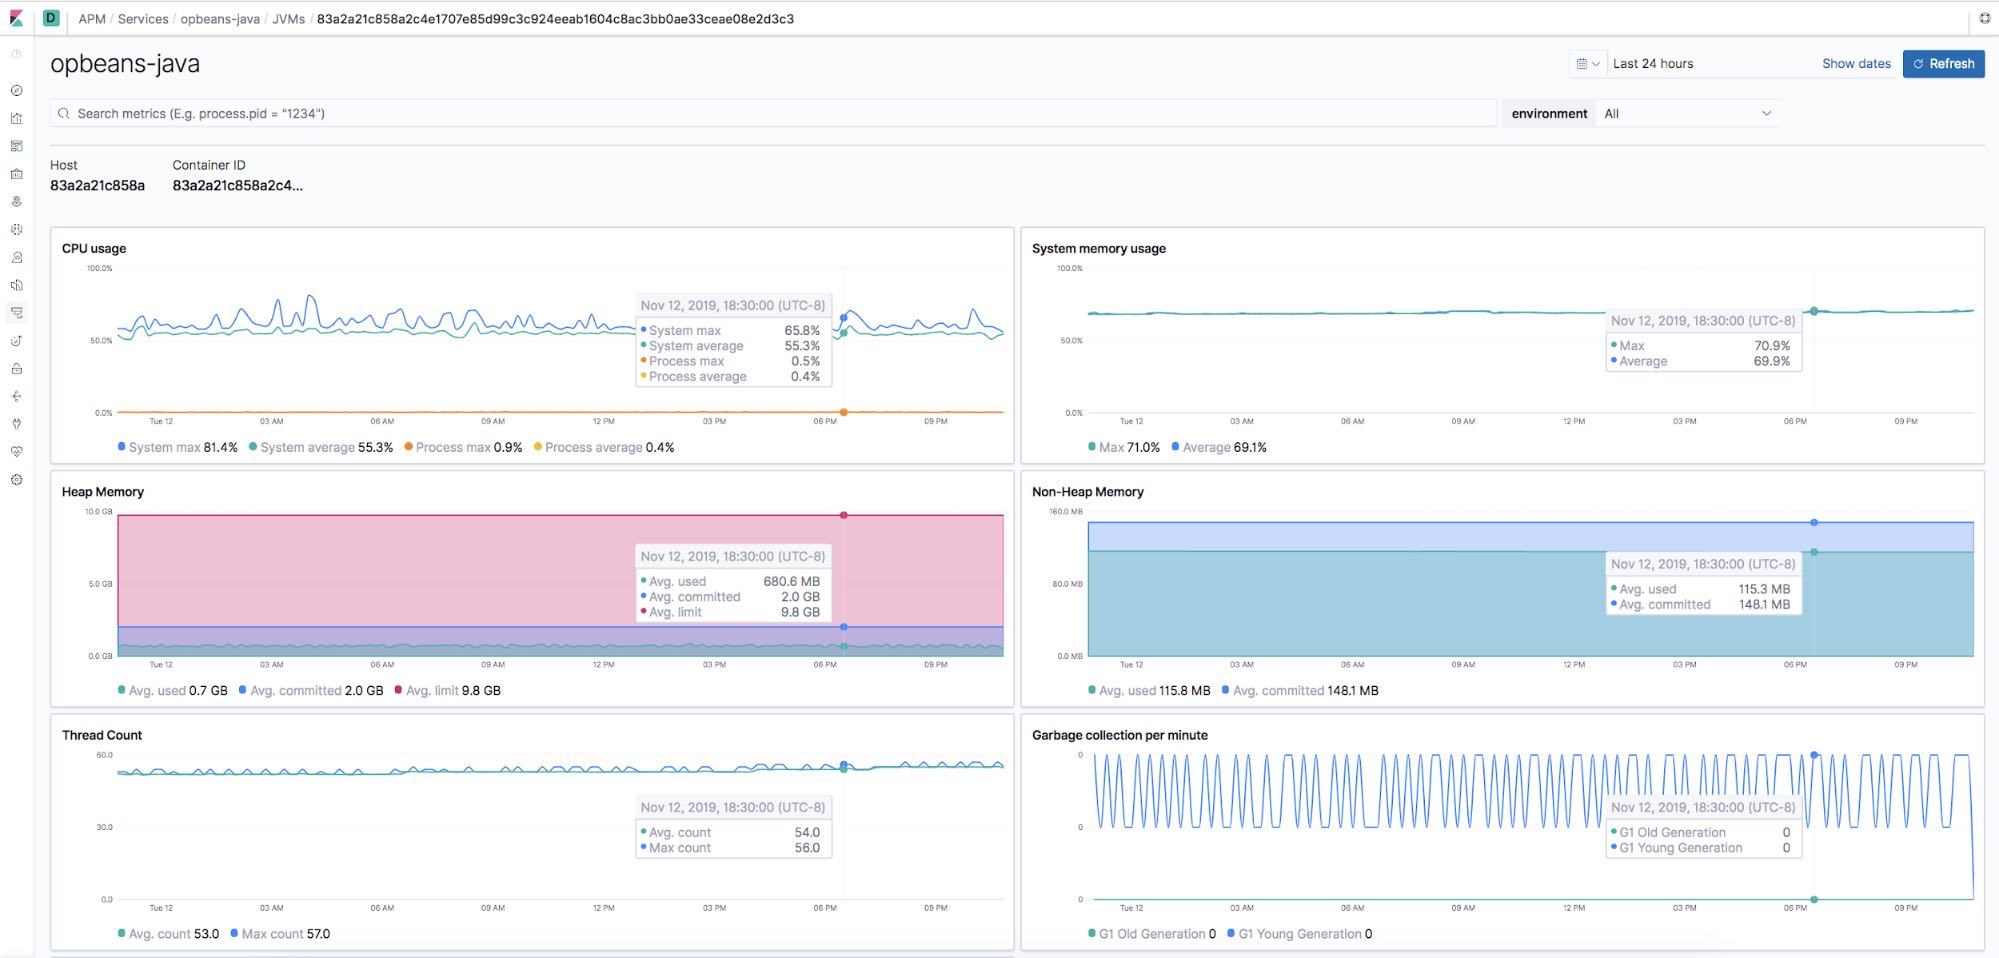
JVM instance level visibility
In 7.5 it's also super easy to troubleshoot your individual JVM instances. A brand new tabular view displays all of your reporting JVMs — along with relevant metric data — to help identity which instances are running hot or are low on resources. Want to dig deeper into a single JVM instance to gain even more insight? Just click one of the JVMs to see more data on CPU, heap/non-heap memory usage, thread count, and garbage collection information for that specific JVM, along with metadata for that instance.

Try it out!
You can access Elastic APM 7.5.0 on the Elasticsearch Service on Elastic Cloud, or you can download it as part of the default distribution of the Elastic Stack. Grab the APM Server (or leverage the one included with an Elasticsearch Service account), instrument your applications with the APM agents, and start monitoring your applications.
Related blogs: