Analyzing Bitcoin Price Behavior with Elasticsearch & Kibana
One of the advantages to Elasticsearch and Kibana is the ability to quickly look at data in a new way. Some time ago, I put all the Bitcoin data into Elasticsearch for a talk I’m working on looking for interesting things in the Bitcoin blockchain, but given the current turmoil I see around the price of Bitcoin, I decided to take a look at what’s going on. There are a number of interesting data points that tell the story of Bitcoin.
Nearly everyone has heard of Bitcoin at this point. Everyone knows it’s some sort of internet money that’s supposed to be untraceable. The data that makes it all work is fascinating, though. To understand what’s happening to Bitcoin right now we need to know a few things about how Bitcoin work. As we have an enormous amount of data available to tell this story it’s easier to show you what Bitcoin is rather than just write about it.
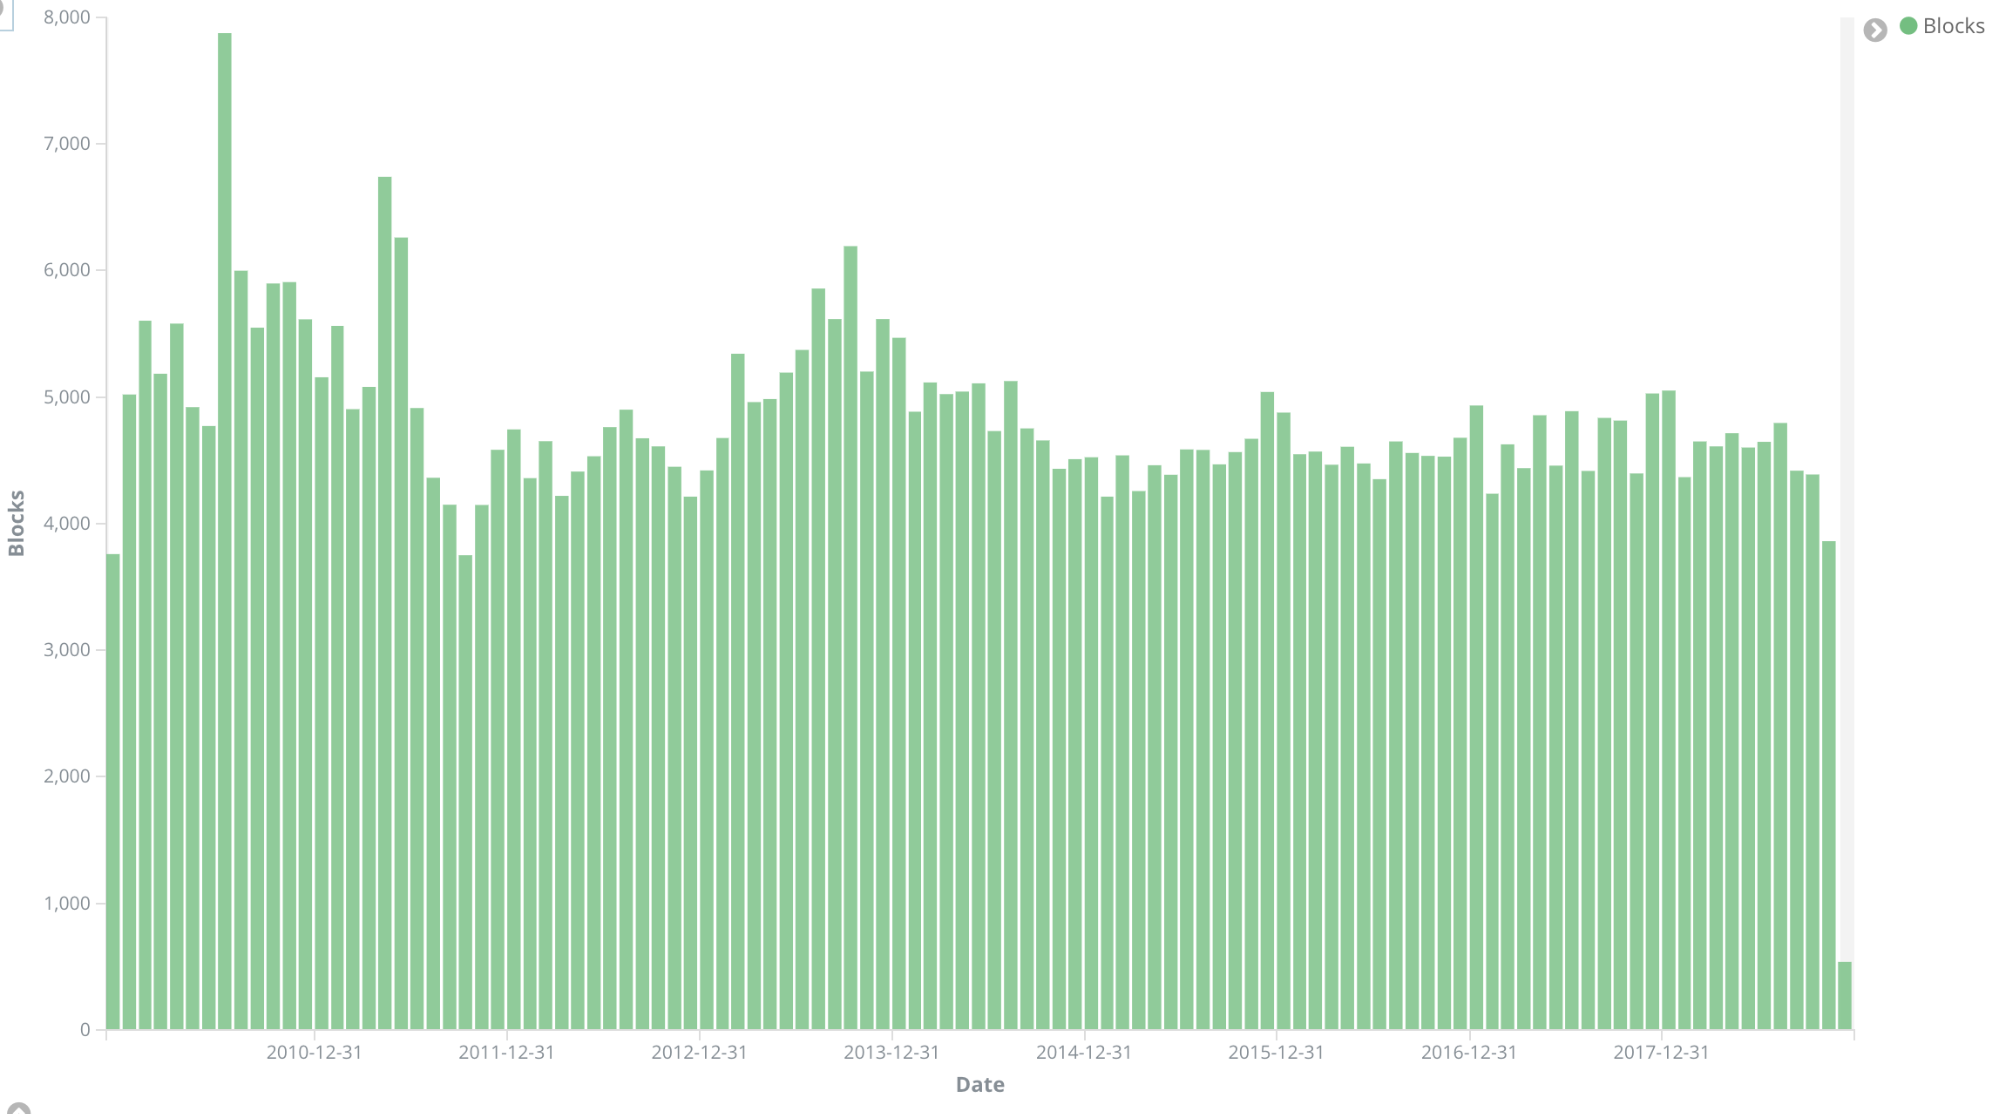
Bitcoins start with something called a block. There are slightly more than 550,000 blocks as of this writing. Blocks are “mined” using a complex mathematical equation. Each block has something called “difficulty” that we’ll refer to later. In theory, a new block is generated every ten minutes. If blocks are being mined too fast, we increase difficulty, if they’re generated too slow, we decrease difficulty. As we can see from the chart, the generation rate of Bitcoins has been pretty consistent over time.
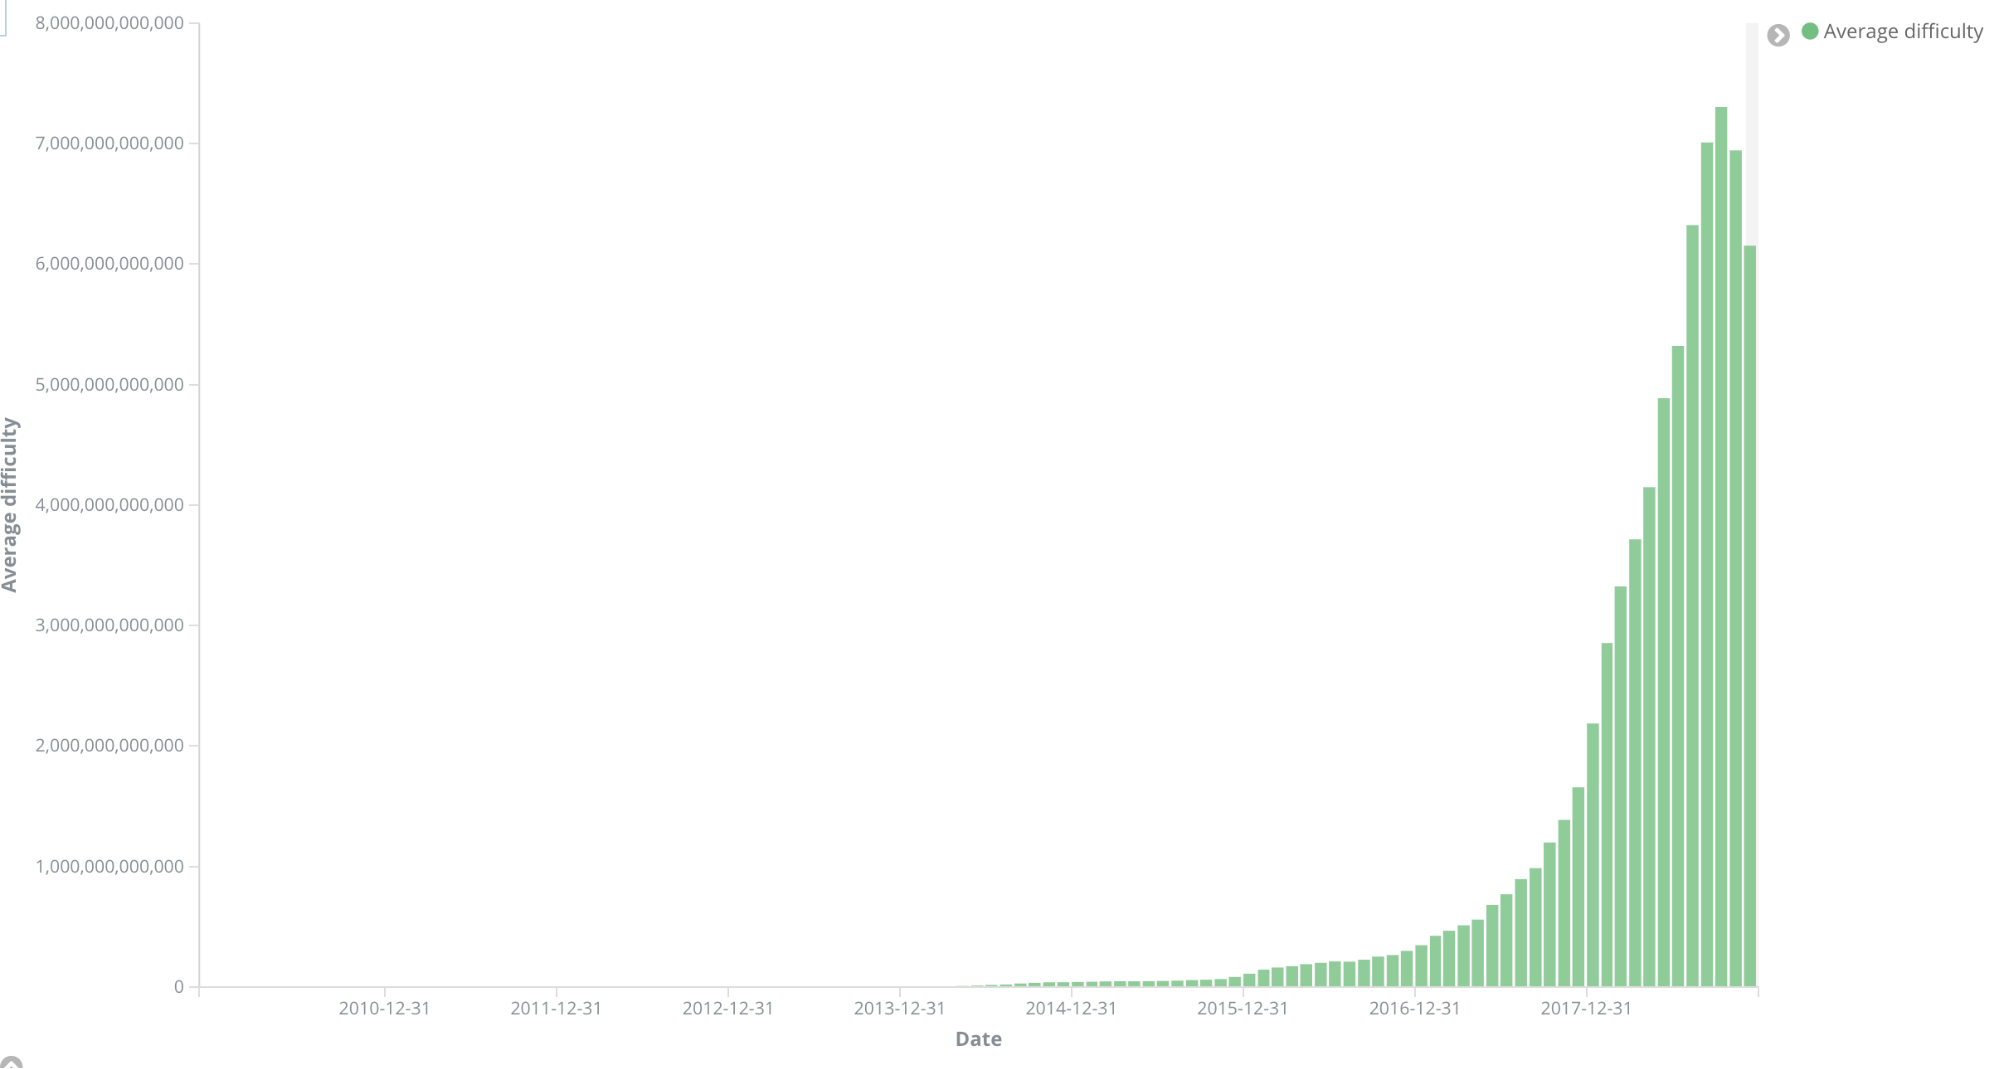
By itself, difficulty isn’t terribly interesting, but it does show us something really important. It’s how much computing power is being dedicated to mining Bitcoins. If you look at the graph below, you can see the difficulty has been growing at an incredible rate since the beginning of bitcoin, probably too fast, and this exponential growth in Bitcoin — and processing cycles for mining — is why you hear talk about it using as much electricity as some countries. As long as literally anyone is mining Bitcoins, we’re going to see a block generated every ten minutes.
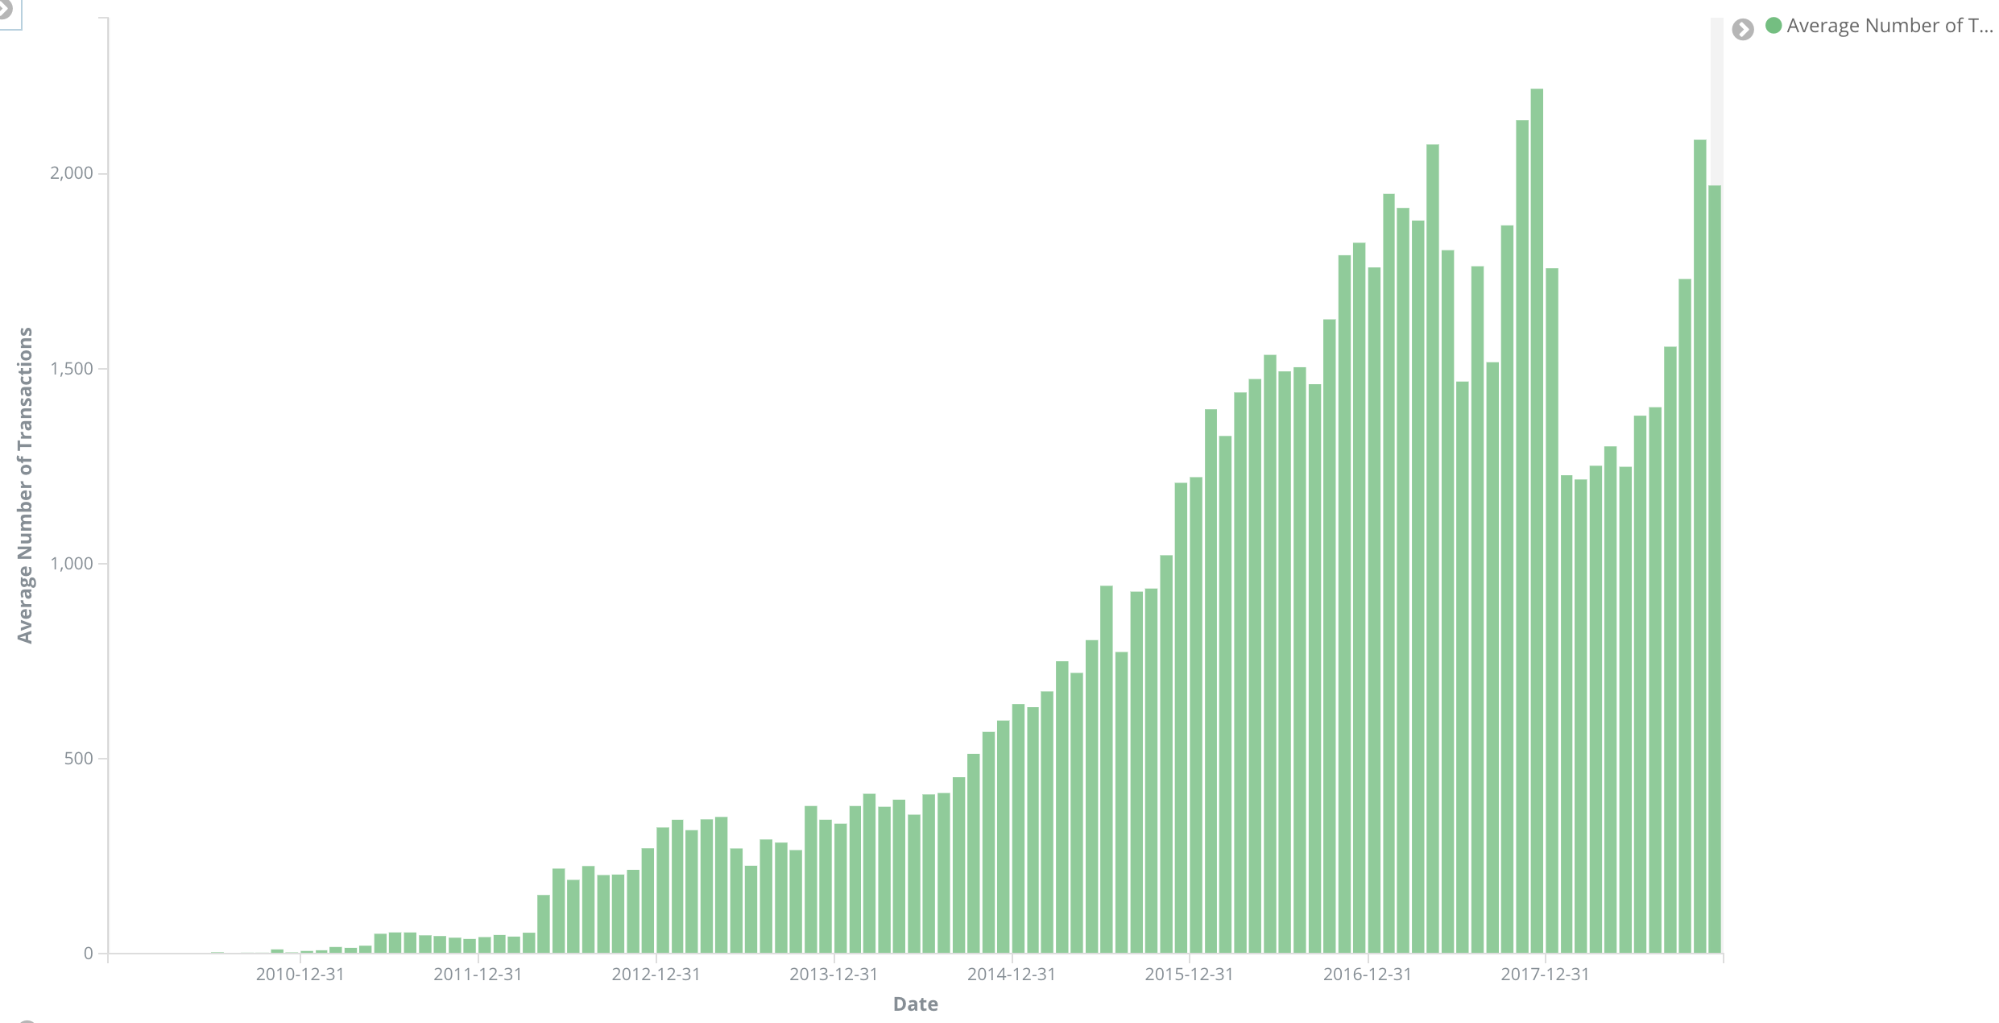
The other important thing we need to understand about Bitcoin is that every block contains one or more transactions. Every time any coins are moved around it has to be part of a transaction. This basically means the number of transactions seen in each block shows how busy the bitcoin network is. The more bitcoins moving around, the more transactions we see.
OK, so at this point we have enough knowledge to look deeper at what’s happening.
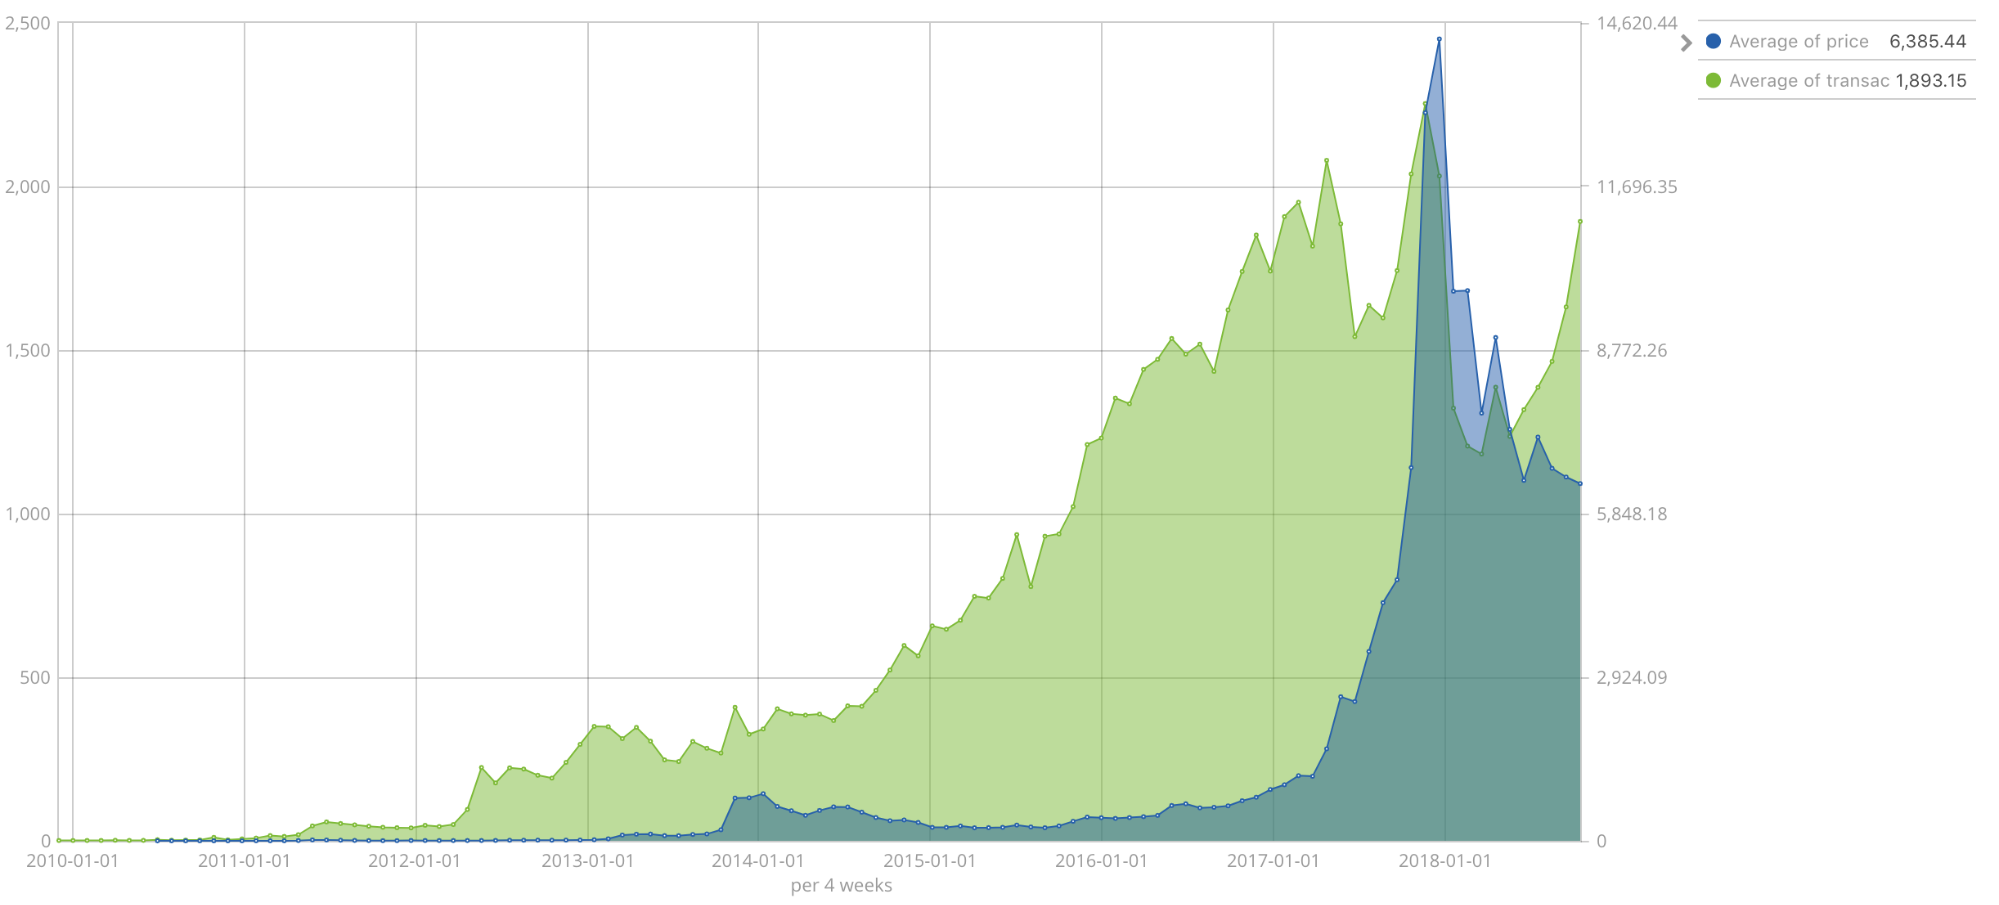
First, we should look at the price of Bitcoin. It’s been a pretty wild ride for the past few months. At one point the price was $20,000 which is pretty crazy. It’s taken quite the turn down recently. You can see the price drop substantially in the last few weeks.
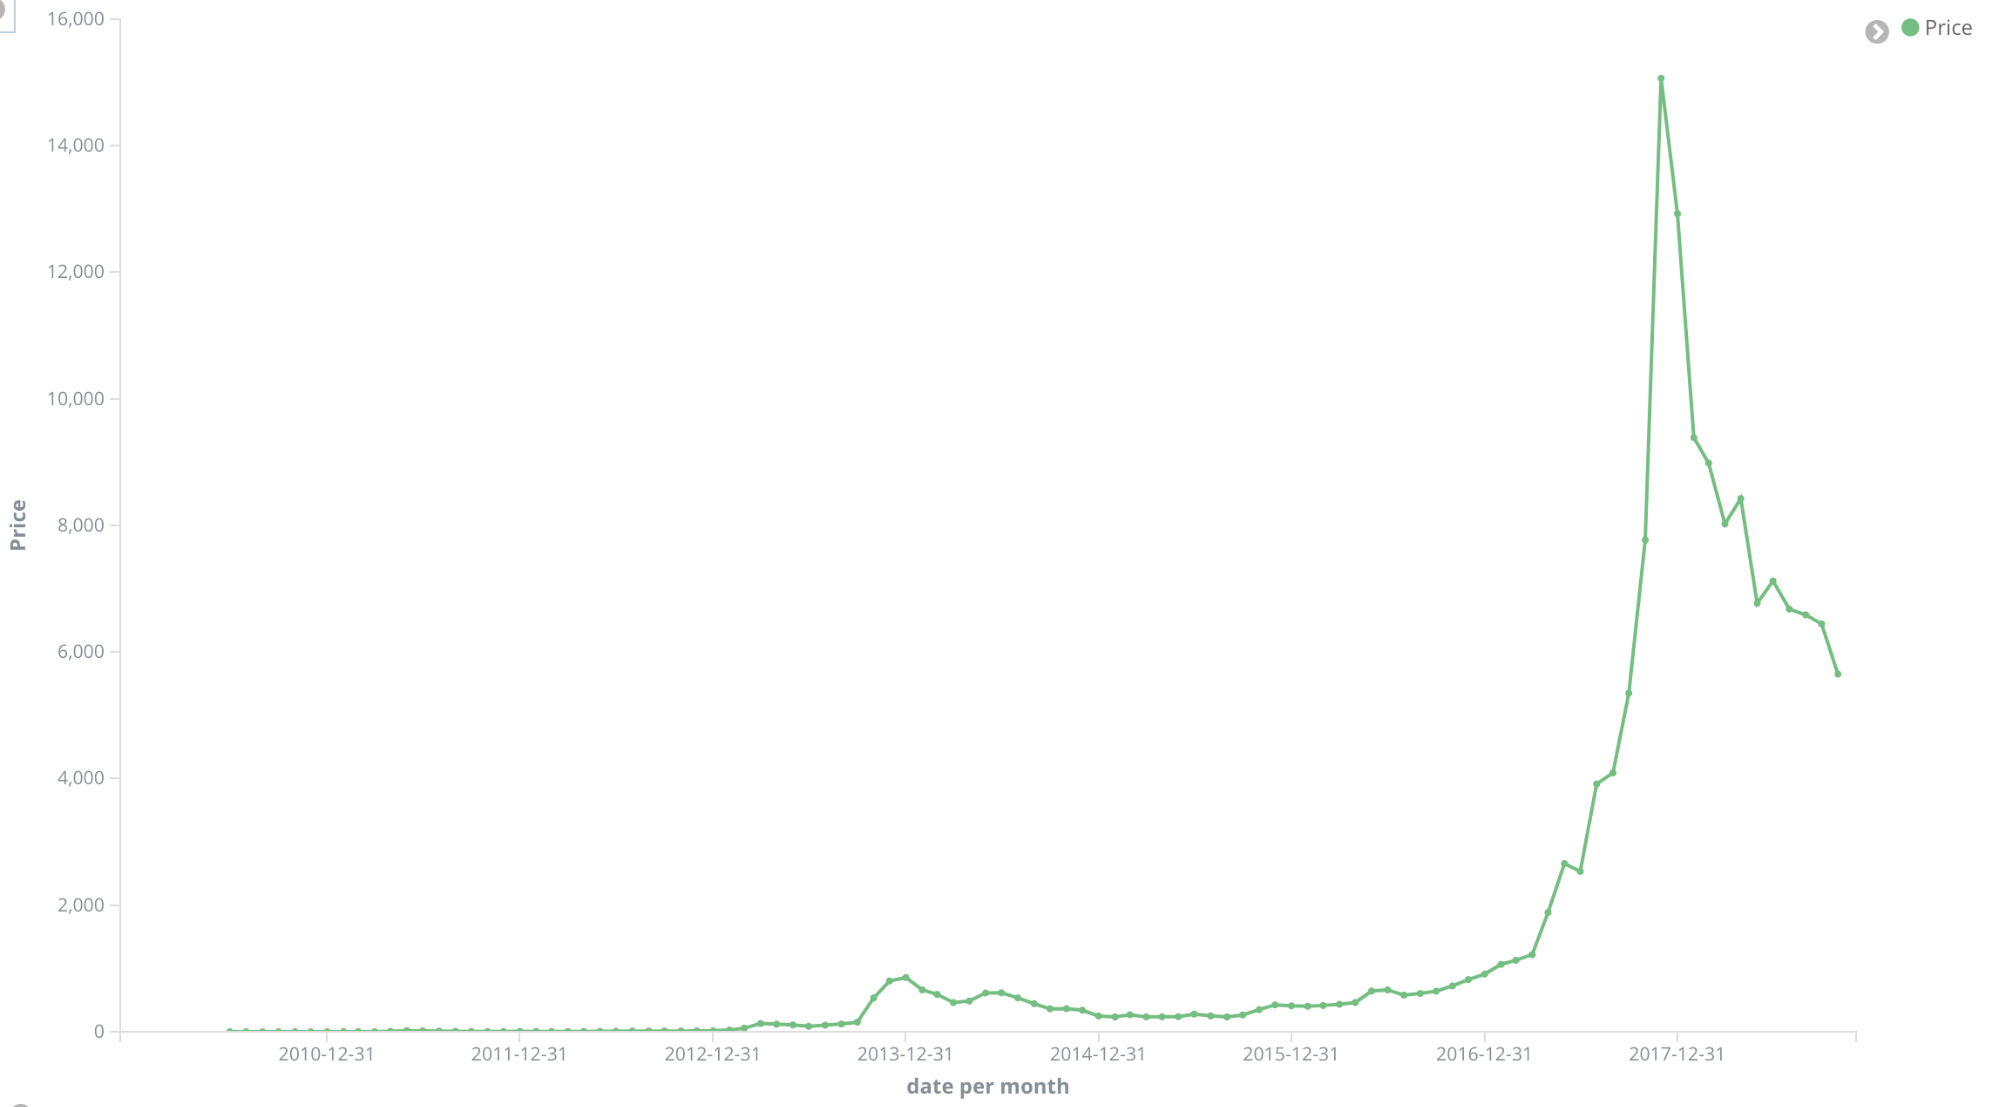
If we compare price vs transactions, it’s not surprising to see the transactions going up as the price goes up. A price going up suggests more people are Buying bitcoin. The basics of economics teach us that if demand is greater than supply, the price goes up. This shouldn’t surprise anyone as it’s basically a sell off. When supply is greater than demand, the price goes down. We also see transactions go up, which would signify a lot of people selling their Bitcoins.
There’s something really important we can learn if we add in the difficulty graph though.
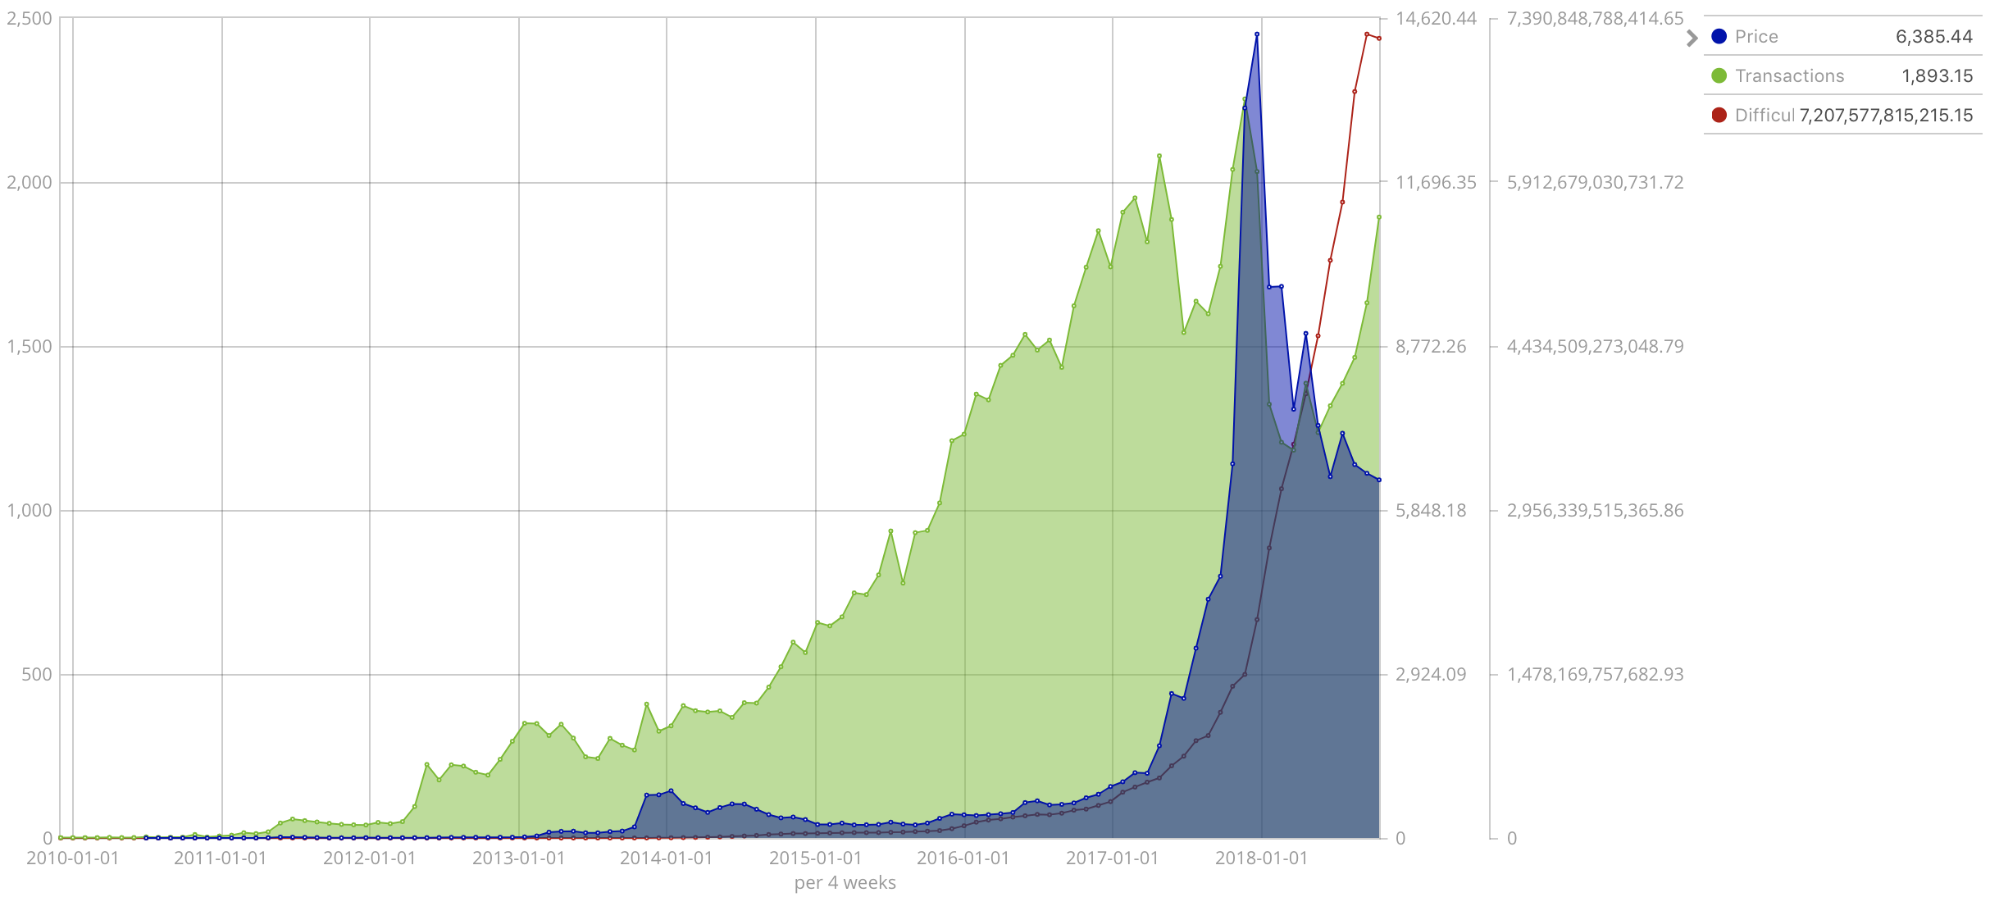
The difficulty is going down, by quite a bit. It’s never gone down quite like this before as we can see from this graph. Difficulty is an important metric to measure the Bitcoin network. We really don’t know how many miners exist in the Bitcoin network. What we do know though is as long as Bitcoin has existed the difficulty has gone up, which suggests an environment where the number of miners is always increasing.
The difficulty is dropping because fewer people are mining Bitcoins, meaning there are fewer Bitcoin miners now than there were at the peak of the chart.
Now we should discuss some of the economics of Bitcoin. Mining Bitcoin is quite expensive today in terms of cost of gear as well as cost of electricity. Bitcoin is mined using Application Specific Integrated Circuits (or ASIC). Gone are the days when CPUs or GPUs can be used to mine bitcoin. CPUs and GPUs can be used to mine other coins, but not Bitcoin. This means that miners have equipment that can only do one thing, mine Bitcoin. It’s also fairly difficult to purchase and costs quite a bit. It’s further complicated because you can’t repurpose the ASIC gear to do anything else. The ASIC gear can only calculate SHA-256 hashes very quickly, which means it’s really only good for calculating Bitcoin hashes.
So let’s put it all together. Miners have very specific gear that only mines Bitcoins. The cost of the gear and electricity is expensive, very expensive. The amount of gear mining Bitcoins on the network is currently decreasing. So one logical conclusion of this is that some miners have taken their gear offline because the return on their investment is negative.
Getting the Bitcoin client running and then getting all the data into Elasticsearch isn’t always simple, but if you find this data as fascinating as I do and have any questions, feel free to ping me on twitter @joshbressers. I’d be happy to chat about results or help you get started.